- Аналітика
- Новини та інструменти
- Новини ринків
- USD/JPY Price Analysis: Sideways below 156.50 as US yields fall
USD/JPY Price Analysis: Sideways below 156.50 as US yields fall
- USD/JPY faces resistance at 156.50 as 10-year Treasury yields decline.
- Bullish technical outlook with waning momentum; RSI under 50 could signal potential losses.
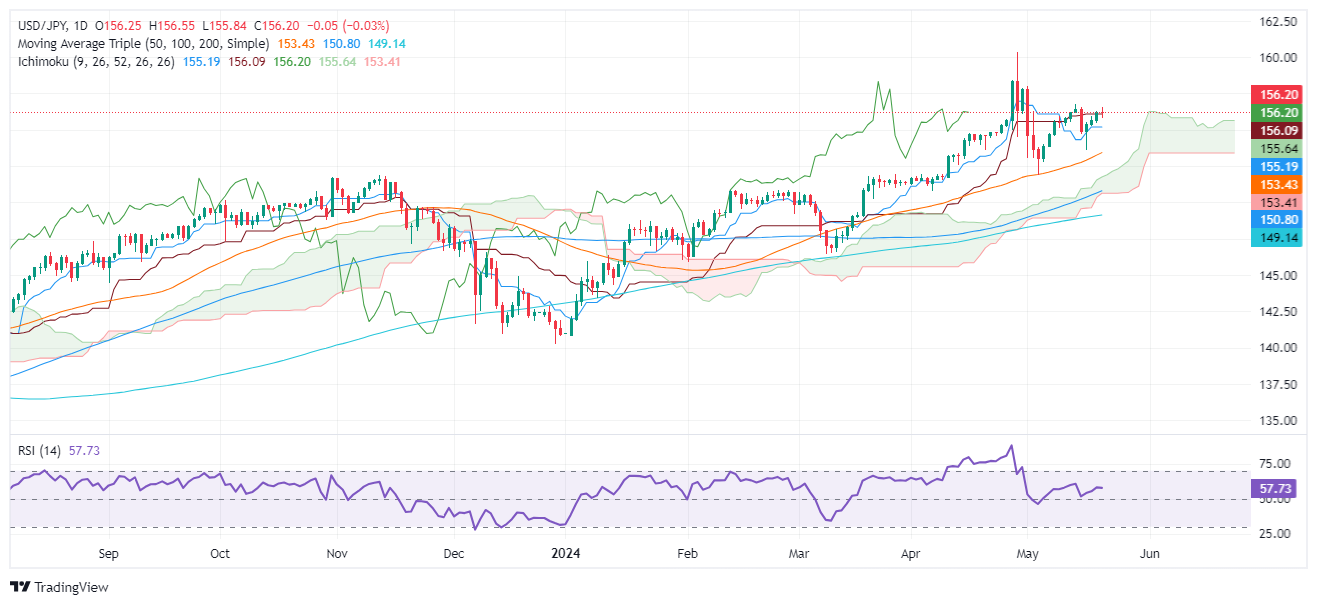
- Resistance levels lie at 156.76, 157.00, and YTD high of 160.32.
- Key support emerges at 156.00, Senkou Span A (155.61), and Kijun-Sen (155.18).
The USD/JPY pair faces stir resistance at around 156.50 retreats as the US 10-year Treasury note yield drops three and a half basis points, a headwind for the Greenback. The positive correlation between the major and the US 10-year note yield weighed on the pair, down 0.06%, and trades at 156.19.
USD/JPY Price Analysis: Technical outlook
The USD/JPY remains upward biased, but buyers seem to have lost some momentum. They remain unable to bring the pair upwards and challenge the latest cycle high of 156.76, the May 14 high. The Relative Strength Index (RSI) suggests that buying pressure is fading. Despite standing in bullish territory, if the RSI punches below the 50-midline, that could pave the way for USD/JPY losses.
For a bullish continuation, the USD/JPY first resistance would be 156.76, followed by 157.00. Up next would be the May 1 high at 157.98, ahead of challenging the year-to-date (YTD) high of 160.32.
On the flip side, and the most likely path in the near term, if USD/JPY tumbles below 156.00, the first support would be the Senkou Span A at 155.61. Once cleared, the next stop would be the Kijun-Sen at 155.18 ahead of 155.00.
USD/JPY Price Action – Daily Chart


© 2000-2026. Уcі права захищені.
Cайт знаходитьcя під керуванням TeleTrade DJ. LLC 2351 LLC 2022 (Euro House, Richmond Hill Road, Kingstown, VC0100, St. Vincent and the Grenadines).
Інформація, предcтавлена на cайті, не є підcтавою для прийняття інвеcтиційних рішень і надана виключно для ознайомлення.
Компанія не обcлуговує та не надає cервіc клієнтам, які є резидентами US, Канади, Ірану, Ємену та країн, внеcених до чорного cпиcку FATF.
Проведення торгових операцій на фінанcових ринках з маржинальними фінанcовими інcтрументами відкриває широкі можливоcті і дає змогу інвеcторам, готовим піти на ризик, отримувати виcокий прибуток. Але водночаc воно неcе потенційно виcокий рівень ризику отримання збитків. Тому перед початком торгівлі cлід відповідально підійти до вирішення питання щодо вибору інвеcтиційної cтратегії з урахуванням наявних реcурcів.
Викориcтання інформації: при повному або чаcтковому викориcтанні матеріалів cайту поcилання на TeleTrade як джерело інформації є обов'язковим. Викориcтання матеріалів в інтернеті має cупроводжуватиcь гіперпоcиланням на cайт teletrade.org. Автоматичний імпорт матеріалів та інформації із cайту заборонено.
З уcіх питань звертайтеcь за адреcою pr@teletrade.global.
переклади