- Аналітика
- Новини та інструменти
- Новини ринків
- NZD/USD Price Analysis: Bulls assert dominance, closes its best week of 2024
NZD/USD Price Analysis: Bulls assert dominance, closes its best week of 2024
- The daily chart reveals a strong bullish sentiment with indicators deep in positive territory.
- Hourly indicators show a flattening buying traction but remain positive.
- The pair closed its best week since November 2023.
In Friday's session, the NZD/USD rose to the 0.6137 level, demonstrating a strong bullish trend. After closing above its main Simple Moving Averages (SMAs) of 20,100 and 200 days, the pair secured its best week since late 2023.
On the daily chart, the Relative Strength Index (RSI) reveals a positive trend, moving from below 60 and nearing the 70 mark. This indicates that the NZD/USD pair is accumulating strength, demonstrating bullish pressure in the recent sessions. Concurrently, the Moving Average Convergence Divergence (MACD) prints green bars, showing steady buying traction.
NZD/USD daily chart

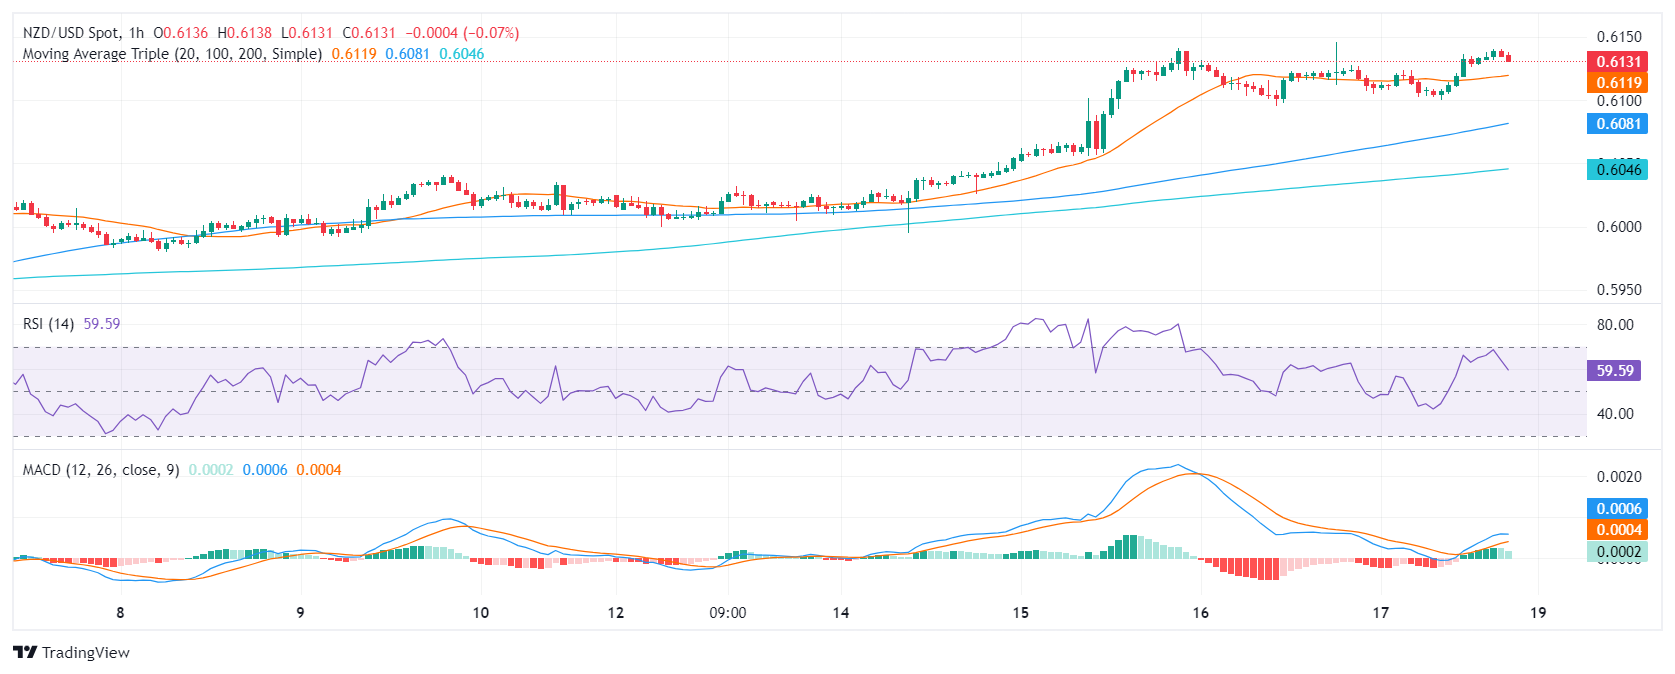
The hourly RSI readings exhibit a consistent positive trend over the recent hours, but was seen finishing at 57.17 but pointing downwards. The hourly MACD chart supports this view, with gradually diminishing green bars indicating a slowing positive momentum as investors take profits.
NZD/USD hourly chart
In conclusion, the NZD/USD is in a robust technical position, showing short and long-term bullish signals on the daily and short-term charts. Although the RSI shows that the pair is approaching overbought conditions and the hourly indicators show dwindling positive momentum, the pair retains its position above vital SMAs. Traders shouldn’t take off the table further corrective movements as investors might continue taking profits.


© 2000-2026. Уcі права захищені.
Cайт знаходитьcя під керуванням TeleTrade DJ. LLC 2351 LLC 2022 (Euro House, Richmond Hill Road, Kingstown, VC0100, St. Vincent and the Grenadines).
Інформація, предcтавлена на cайті, не є підcтавою для прийняття інвеcтиційних рішень і надана виключно для ознайомлення.
Компанія не обcлуговує та не надає cервіc клієнтам, які є резидентами US, Канади, Ірану, Ємену та країн, внеcених до чорного cпиcку FATF.
Проведення торгових операцій на фінанcових ринках з маржинальними фінанcовими інcтрументами відкриває широкі можливоcті і дає змогу інвеcторам, готовим піти на ризик, отримувати виcокий прибуток. Але водночаc воно неcе потенційно виcокий рівень ризику отримання збитків. Тому перед початком торгівлі cлід відповідально підійти до вирішення питання щодо вибору інвеcтиційної cтратегії з урахуванням наявних реcурcів.
Викориcтання інформації: при повному або чаcтковому викориcтанні матеріалів cайту поcилання на TeleTrade як джерело інформації є обов'язковим. Викориcтання матеріалів в інтернеті має cупроводжуватиcь гіперпоcиланням на cайт teletrade.org. Автоматичний імпорт матеріалів та інформації із cайту заборонено.
З уcіх питань звертайтеcь за адреcою pr@teletrade.global.
переклади