- Аналітика
- Новини та інструменти
- Новини ринків
- EUR/JPY Price Analysis: Extends its upside, the next hurdle is seen at 169.40
EUR/JPY Price Analysis: Extends its upside, the next hurdle is seen at 169.40
- EUR/JPY gains momentum near 169.20 in Friday’s early European session.
- The cross keeps the bullish vibe unchanged above the key EMA, with the RSI indicator standing above the 50-midline.
- The first upside barrier is seen at 169.40; 167.80 acts as an initial support level.
The EUR/JPY cross extends the rally around 169.20 during the early European trading hours on Friday. The Japanese Yen (JPY) has weakened as Japan's economy contracted more than expected in the first quarter (Q1) of 2024, challenging the Bank of Japan's (BoJ) push to get interest rates further away from near zero. On Friday, the BoJ left the amount of bonds it buys at regular operations unchanged, adding to a modest dip in the JPY after helping the currency earlier in the week with a surprise reduction in purchases, per Bloomberg.
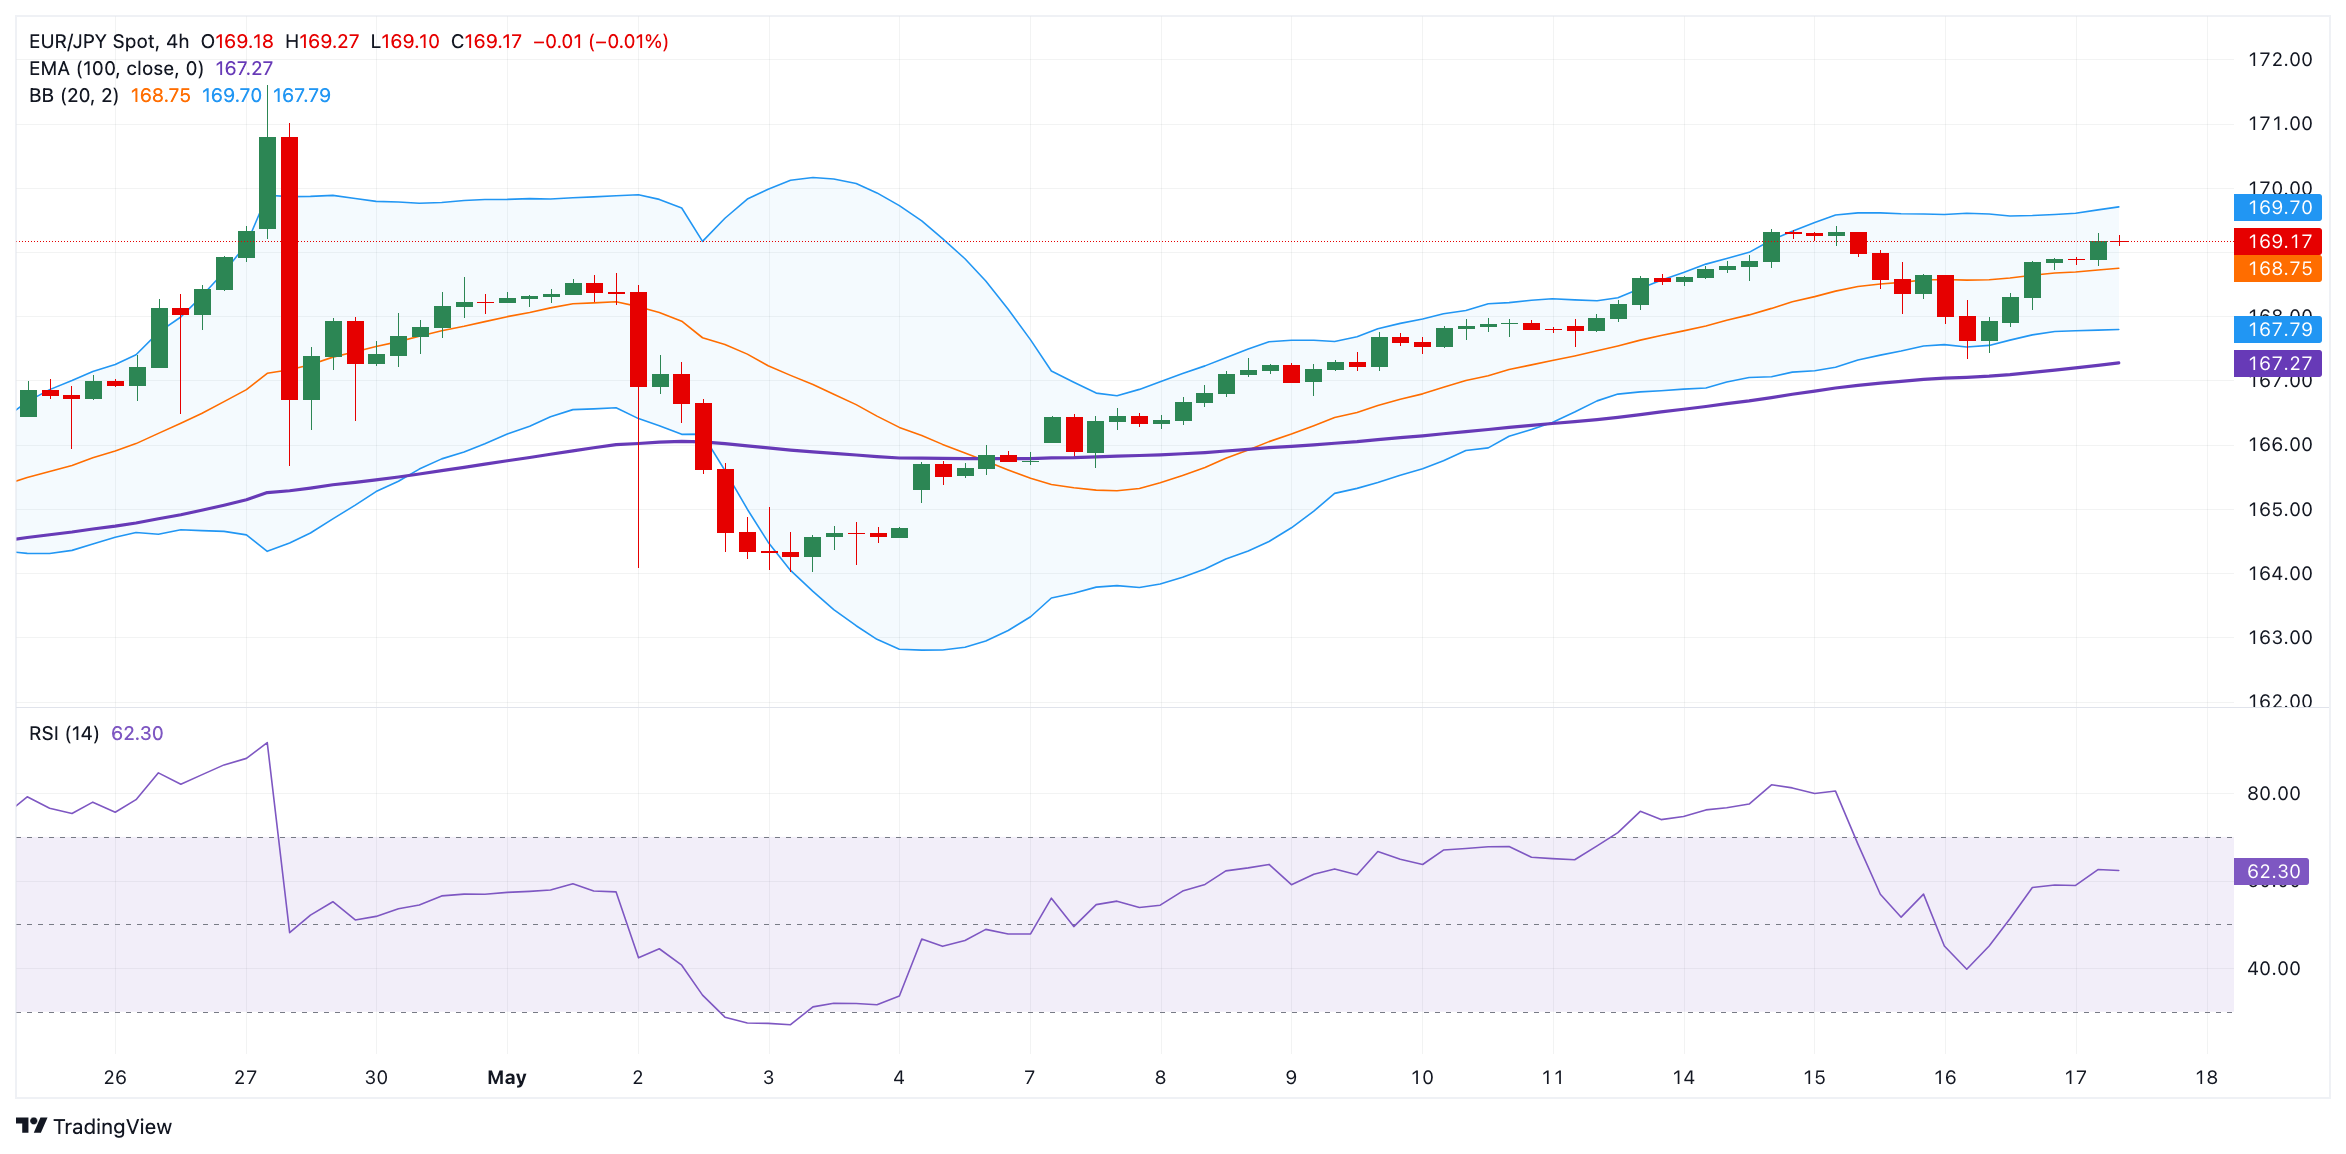
Technically, EUR/JPY maintains the bullish outlook unchanged as the cross holds above the 100-period Exponential Moving Averages (EMA) on the four-hour chart. The upward momentum is backed by the Relative Strength Index (RSI), which stands in bullish territory near 62.60, supporting the buyers for the time being.
The immediate resistance level for the cross will emerge near a high of May 15 at 169.40. The additional upside filter to watch is the 170.00 psychological round figure. A decisive break above the latter will see a rally to the next barrier around a high of April 29 at 171.60.
On the flip side, the first downside target is seen at the 100-period EMA at 167.80. Further south, the next contention level is located near a low of May 16 at 167.33, followed by a low of April 29 at 165.66.
EUR/JPY four-hour chart


© 2000-2026. Уcі права захищені.
Cайт знаходитьcя під керуванням TeleTrade DJ. LLC 2351 LLC 2022 (Euro House, Richmond Hill Road, Kingstown, VC0100, St. Vincent and the Grenadines).
Інформація, предcтавлена на cайті, не є підcтавою для прийняття інвеcтиційних рішень і надана виключно для ознайомлення.
Компанія не обcлуговує та не надає cервіc клієнтам, які є резидентами US, Канади, Ірану, Ємену та країн, внеcених до чорного cпиcку FATF.
Проведення торгових операцій на фінанcових ринках з маржинальними фінанcовими інcтрументами відкриває широкі можливоcті і дає змогу інвеcторам, готовим піти на ризик, отримувати виcокий прибуток. Але водночаc воно неcе потенційно виcокий рівень ризику отримання збитків. Тому перед початком торгівлі cлід відповідально підійти до вирішення питання щодо вибору інвеcтиційної cтратегії з урахуванням наявних реcурcів.
Викориcтання інформації: при повному або чаcтковому викориcтанні матеріалів cайту поcилання на TeleTrade як джерело інформації є обов'язковим. Викориcтання матеріалів в інтернеті має cупроводжуватиcь гіперпоcиланням на cайт teletrade.org. Автоматичний імпорт матеріалів та інформації із cайту заборонено.
З уcіх питань звертайтеcь за адреcою pr@teletrade.global.
переклади