- Аналітика
- Новини та інструменти
- Новини ринків
- NZD/USD Price Analysis: Buyers take a breather after Wednesday’s rally, outlook remains positive
NZD/USD Price Analysis: Buyers take a breather after Wednesday’s rally, outlook remains positive
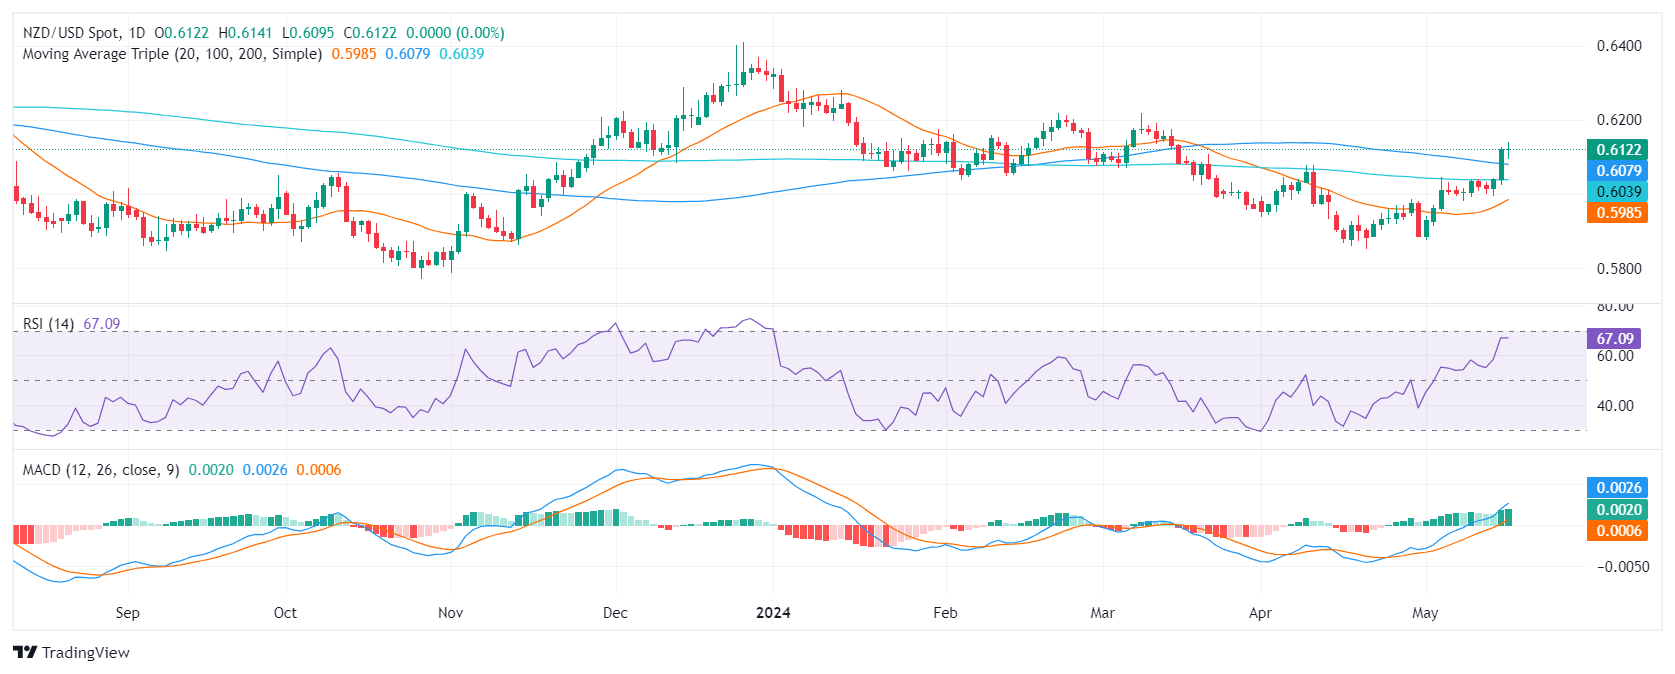
- The daily RSI shows that the pair has strong positive momentum, approaching overbought conditions but turning flat.
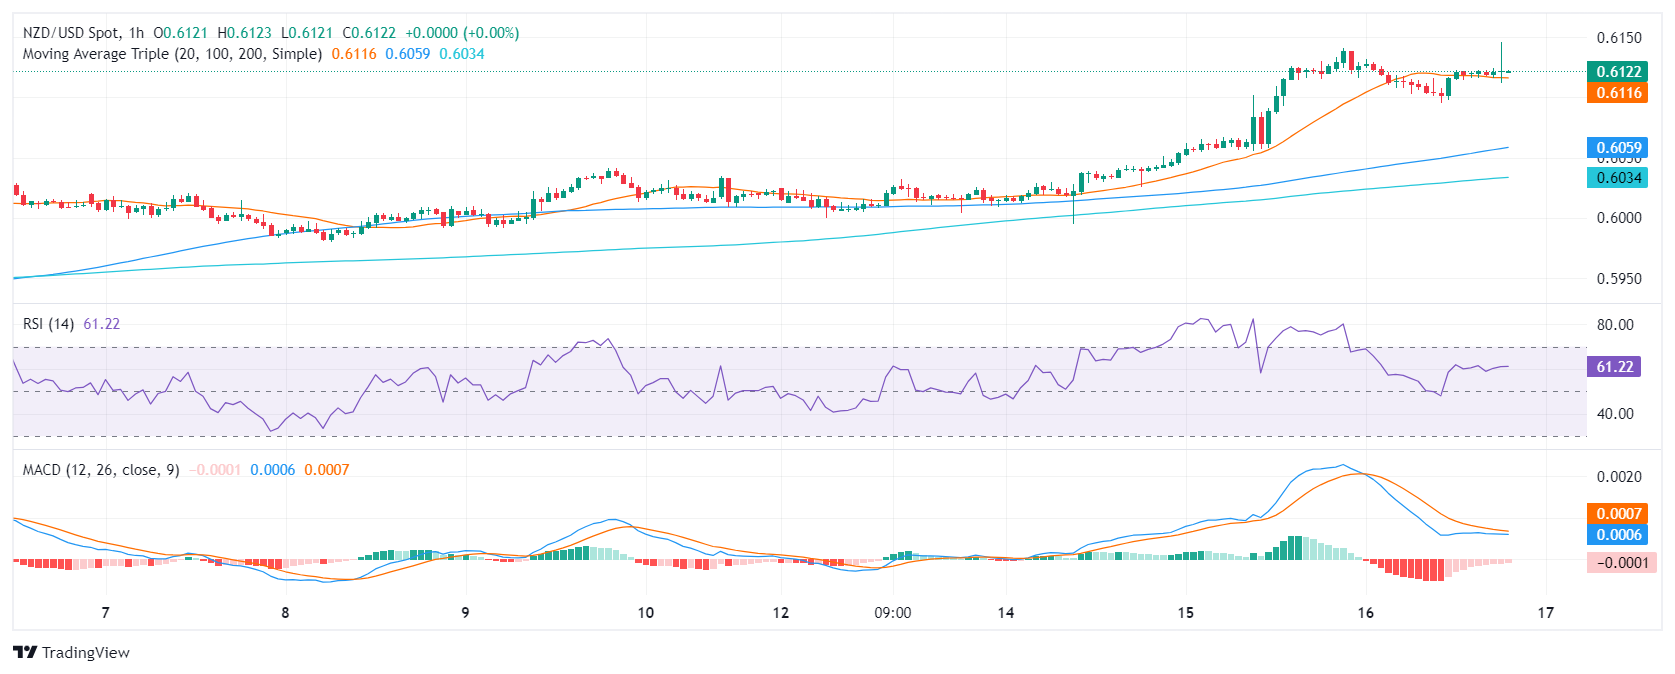
- Hourly RSI indicates a slight retreat, hinting at some short-term consolidation.
- The pair remains firm above its main SMAs, signaling a solid bullish sentiment in the near and distant future.
On Thursday's session, the NZD/USD remained flat at around 0.6120, as investors seem to be taking profits. After the Kiwi jumped above its main Simple Moving Averages (SMAs) the outlook turned bullish for the pair, but further consolidation may be in the horizon.
On the daily chart, the Relative Strength Index (RSI) shows positive momentum, fluctuating within positive territory, and nearing overbought status but turned flat on Thursday. The green bars of the Moving Average Convergence Divergence (MACD) reinforce the positive trend but are also flattened.
NZD/USD daily chart
Moving to the hourly chart, mixed signals are visible. The RSI retreated slightly after being deep in overbought terrain, revealing a subtle slowdown in buying enthusiasm in recent hours. The red bars of the MACD suggest that the buying traction was weak in the last hours.
NZD/USD hourly chart
To conclude, bearing in mind the positive RSI indicators and the green MACD histogram, alongside the currency pair being above critical SMAs, the market seems to favor the bulls for the NZD/USD pair in both the short and long term but further consolidation shouldn’t be taken off the table. However, the conquered 100- and 200-day SMA will be a strong support that could limit losses.


© 2000-2026. Уcі права захищені.
Cайт знаходитьcя під керуванням TeleTrade DJ. LLC 2351 LLC 2022 (Euro House, Richmond Hill Road, Kingstown, VC0100, St. Vincent and the Grenadines).
Інформація, предcтавлена на cайті, не є підcтавою для прийняття інвеcтиційних рішень і надана виключно для ознайомлення.
Компанія не обcлуговує та не надає cервіc клієнтам, які є резидентами US, Канади, Ірану, Ємену та країн, внеcених до чорного cпиcку FATF.
Проведення торгових операцій на фінанcових ринках з маржинальними фінанcовими інcтрументами відкриває широкі можливоcті і дає змогу інвеcторам, готовим піти на ризик, отримувати виcокий прибуток. Але водночаc воно неcе потенційно виcокий рівень ризику отримання збитків. Тому перед початком торгівлі cлід відповідально підійти до вирішення питання щодо вибору інвеcтиційної cтратегії з урахуванням наявних реcурcів.
Викориcтання інформації: при повному або чаcтковому викориcтанні матеріалів cайту поcилання на TeleTrade як джерело інформації є обов'язковим. Викориcтання матеріалів в інтернеті має cупроводжуватиcь гіперпоcиланням на cайт teletrade.org. Автоматичний імпорт матеріалів та інформації із cайту заборонено.
З уcіх питань звертайтеcь за адреcою pr@teletrade.global.
переклади