- Аналітика
- Новини та інструменти
- Новини ринків
- Silver Price Analysis: XAG/USD rally pauses as ‘doji’ emerges as US yields climb
Silver Price Analysis: XAG/USD rally pauses as ‘doji’ emerges as US yields climb
- Silver trades at $29.60, posting slight losses of 0.04% amid mixed US economic data.
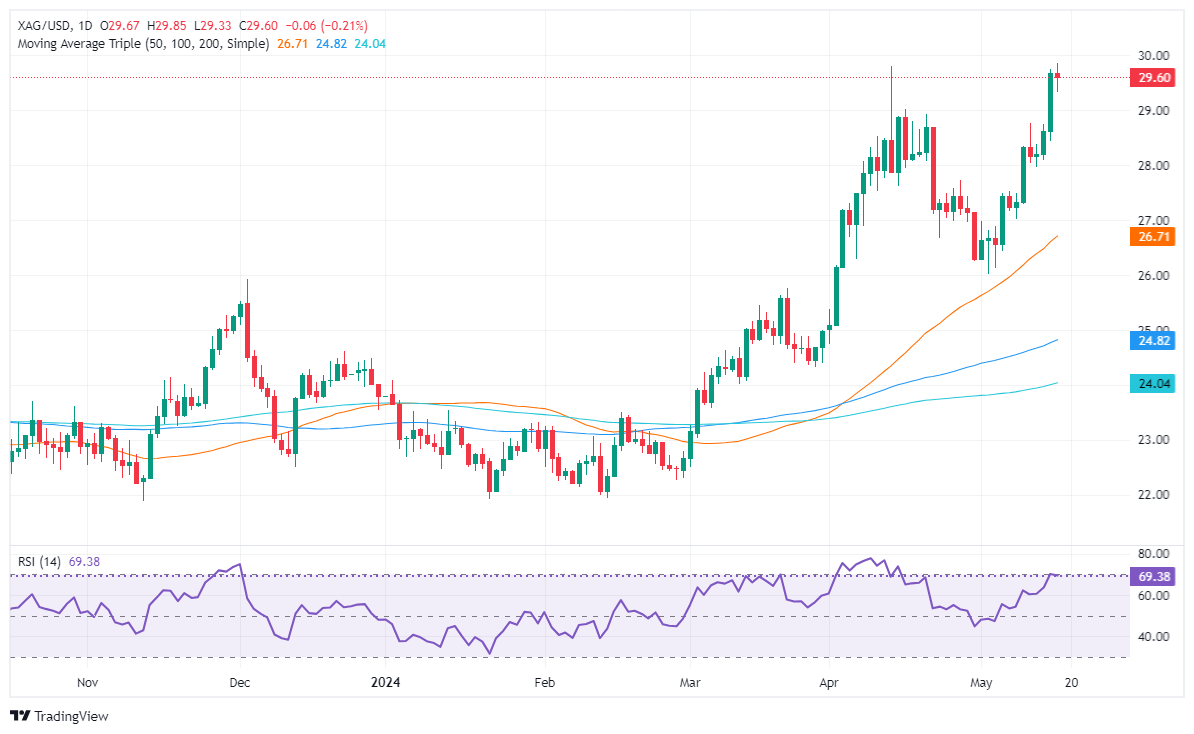
- Technical outlook shows a ‘doji’ pattern, signaling indecision among traders.
- Silver must stay above $29.00 to challenge the YTD high of $29.79 and further resistance levels at $32.15 and $35.40.
Silver’s advancement paused on Thursday, as the grey metal posted minuscule losses of 0.04%, exchanging hands virtually unchanged. Jobs data, along with mixed housing data and the lack of strength in the manufacturing and industrial sectors, boosted US yields and the Greenback. Therefore, the grey metal dropped and traded at $29.60 at the time of writing.
XAG/USD Price Analysis: Technical outlook
Silver’s uptrend remains in place, but Thursday’s price action forming a ‘doji’ indicates that neither buyers nor sellers are in the domain of price action. It should be said that a ‘double top’ looms. However, momentum favors the former, as the Relative Strength Index (RSI) continues to aim upward despite approaching overbought conditions.
That said, if XAG/USD stays above $29.00, buyers could remain hopeful of testing the year-to-date (YTD) high of $29.79. A breach of the latter will pave the way to challenge the February 2013 high of $32.15, followed by the October 2012 high of $35.40.
Conversely, sellers must drag Silver’s price below the $29.00 figure. In that outcome, the pullback could reach the May 18, 2021, high turned support at $28.75, followed by the $28.00 mark. Further losses lie below the latter, with key support seen at $27.00.
XAG/USD Price Action – Daily Chart
© 2000-2026. Уcі права захищені.
Cайт знаходитьcя під керуванням TeleTrade DJ. LLC 2351 LLC 2022 (Euro House, Richmond Hill Road, Kingstown, VC0100, St. Vincent and the Grenadines).
Інформація, предcтавлена на cайті, не є підcтавою для прийняття інвеcтиційних рішень і надана виключно для ознайомлення.
Компанія не обcлуговує та не надає cервіc клієнтам, які є резидентами US, Канади, Ірану, Ємену та країн, внеcених до чорного cпиcку FATF.
Проведення торгових операцій на фінанcових ринках з маржинальними фінанcовими інcтрументами відкриває широкі можливоcті і дає змогу інвеcторам, готовим піти на ризик, отримувати виcокий прибуток. Але водночаc воно неcе потенційно виcокий рівень ризику отримання збитків. Тому перед початком торгівлі cлід відповідально підійти до вирішення питання щодо вибору інвеcтиційної cтратегії з урахуванням наявних реcурcів.
Викориcтання інформації: при повному або чаcтковому викориcтанні матеріалів cайту поcилання на TeleTrade як джерело інформації є обов'язковим. Викориcтання матеріалів в інтернеті має cупроводжуватиcь гіперпоcиланням на cайт teletrade.org. Автоматичний імпорт матеріалів та інформації із cайту заборонено.
З уcіх питань звертайтеcь за адреcою pr@teletrade.global.


