- Аналітика
- Новини та інструменти
- Новини ринків
- NZD/USD Price Analysis: Bulls gather traction and brighten the outlook, indicators hit overbought conditions
NZD/USD Price Analysis: Bulls gather traction and brighten the outlook, indicators hit overbought conditions
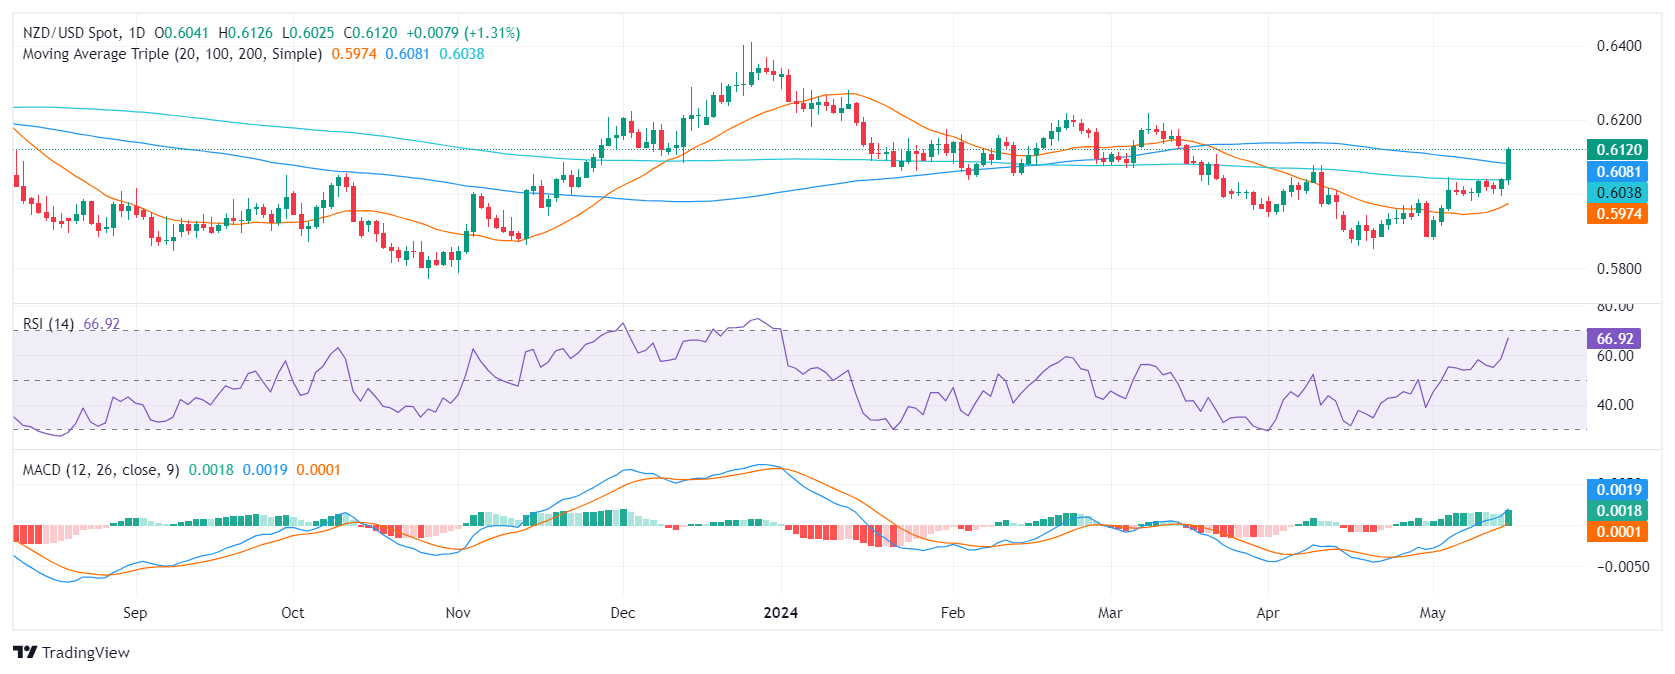
- The daily RSI of the NZD/USD signals it is approaching overbought, which often indicates future consolidation or potential reversal.
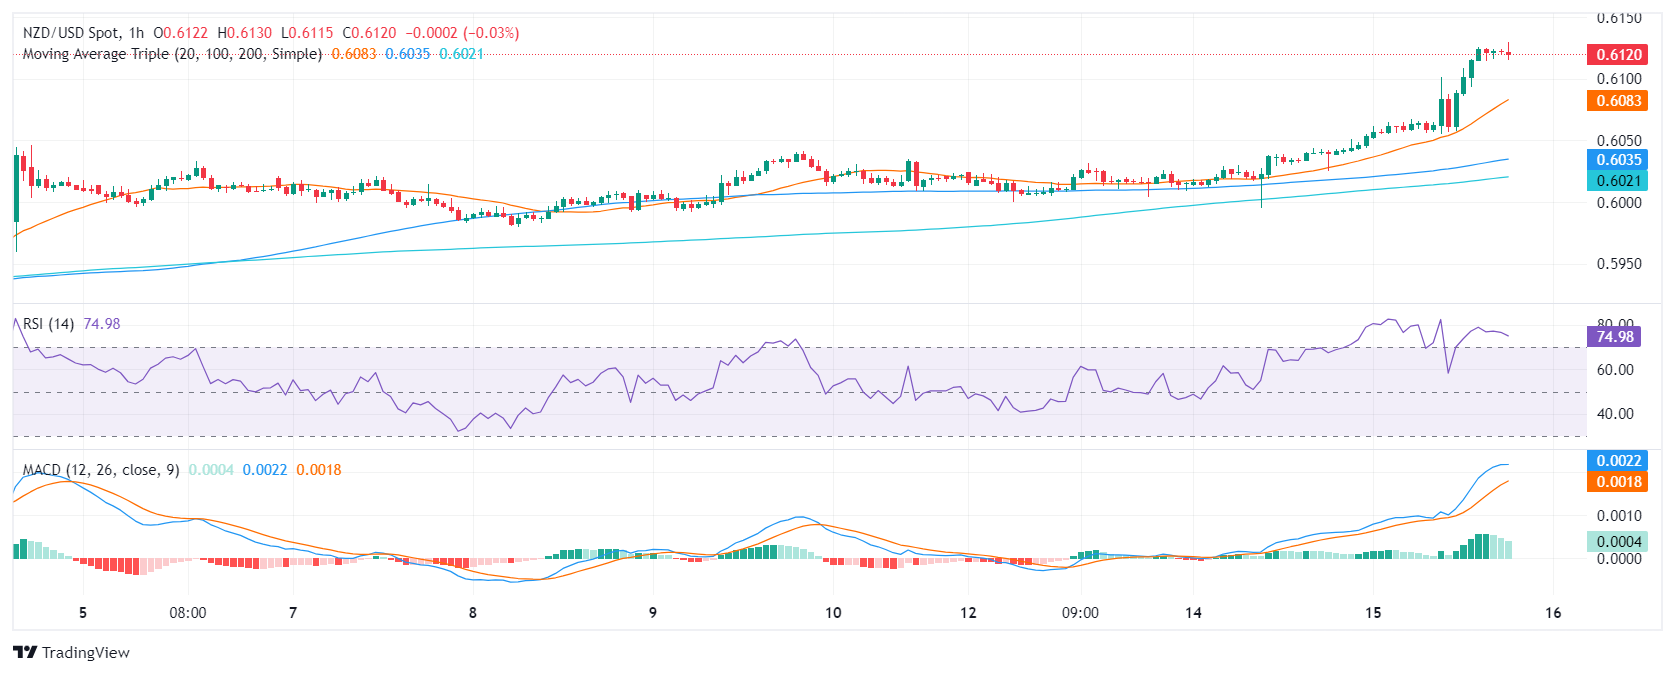
- The same indicators in the hourly chart further strengthen this view, specifically, with the RSI crossing the 70 mark.
- Buyers regained the 100 and 200-day SMAs, and this points to a bullish outlook.
In the Wednesday session, the NZD/USD pair rides a strong bullish wave, with a recent increase of 1.28%. The uptick made the pair jump above its 100 and 200-day Simple Moving Averages (SMAs), indicating that the outlook turned positive for the pair. However, as indicators approach overbought conditions, a consolidation may be incoming.
On the daily chart, the Relative Strength Index (RSI) indicates that NZD/USD is approaching overbought territory. The positive trend evident over the past few days, along with the recent surge, reveals that the strength is currently with buyers. However, this upward pressure may soon decrease, as the RSI nearing overbought conditions often signals future consolidation or potential reversal.
NZD/USD daily chart
The hourly chart shows that RSI readings exceeded 70, reinforcing indications of overbought conditions. The recent Moving Average Convergence Divergence (MACD) showing flat green bars indicates sustained but flat positive momentum.
NZD/USD hourly chart
In conclusion, the technical indicators for NZD/USD suggest strong buyer momentum. However, the RSI's proximity to overbought conditions hints at a potential easing of this upward pressure. This, coupled with the strong bullish trend indicated by the jumping above longer-term SMAs, presents a positive outlook but demands careful observation for potential corrections.


© 2000-2026. Уcі права захищені.
Cайт знаходитьcя під керуванням TeleTrade DJ. LLC 2351 LLC 2022 (Euro House, Richmond Hill Road, Kingstown, VC0100, St. Vincent and the Grenadines).
Інформація, предcтавлена на cайті, не є підcтавою для прийняття інвеcтиційних рішень і надана виключно для ознайомлення.
Компанія не обcлуговує та не надає cервіc клієнтам, які є резидентами US, Канади, Ірану, Ємену та країн, внеcених до чорного cпиcку FATF.
Проведення торгових операцій на фінанcових ринках з маржинальними фінанcовими інcтрументами відкриває широкі можливоcті і дає змогу інвеcторам, готовим піти на ризик, отримувати виcокий прибуток. Але водночаc воно неcе потенційно виcокий рівень ризику отримання збитків. Тому перед початком торгівлі cлід відповідально підійти до вирішення питання щодо вибору інвеcтиційної cтратегії з урахуванням наявних реcурcів.
Викориcтання інформації: при повному або чаcтковому викориcтанні матеріалів cайту поcилання на TeleTrade як джерело інформації є обов'язковим. Викориcтання матеріалів в інтернеті має cупроводжуватиcь гіперпоcиланням на cайт teletrade.org. Автоматичний імпорт матеріалів та інформації із cайту заборонено.
З уcіх питань звертайтеcь за адреcою pr@teletrade.global.
переклади