- Аналітика
- Новини та інструменти
- Новини ринків
- EUR/JPY Price Analysis: Bulls sustain upward momentum despite investors taking profits
EUR/JPY Price Analysis: Bulls sustain upward momentum despite investors taking profits
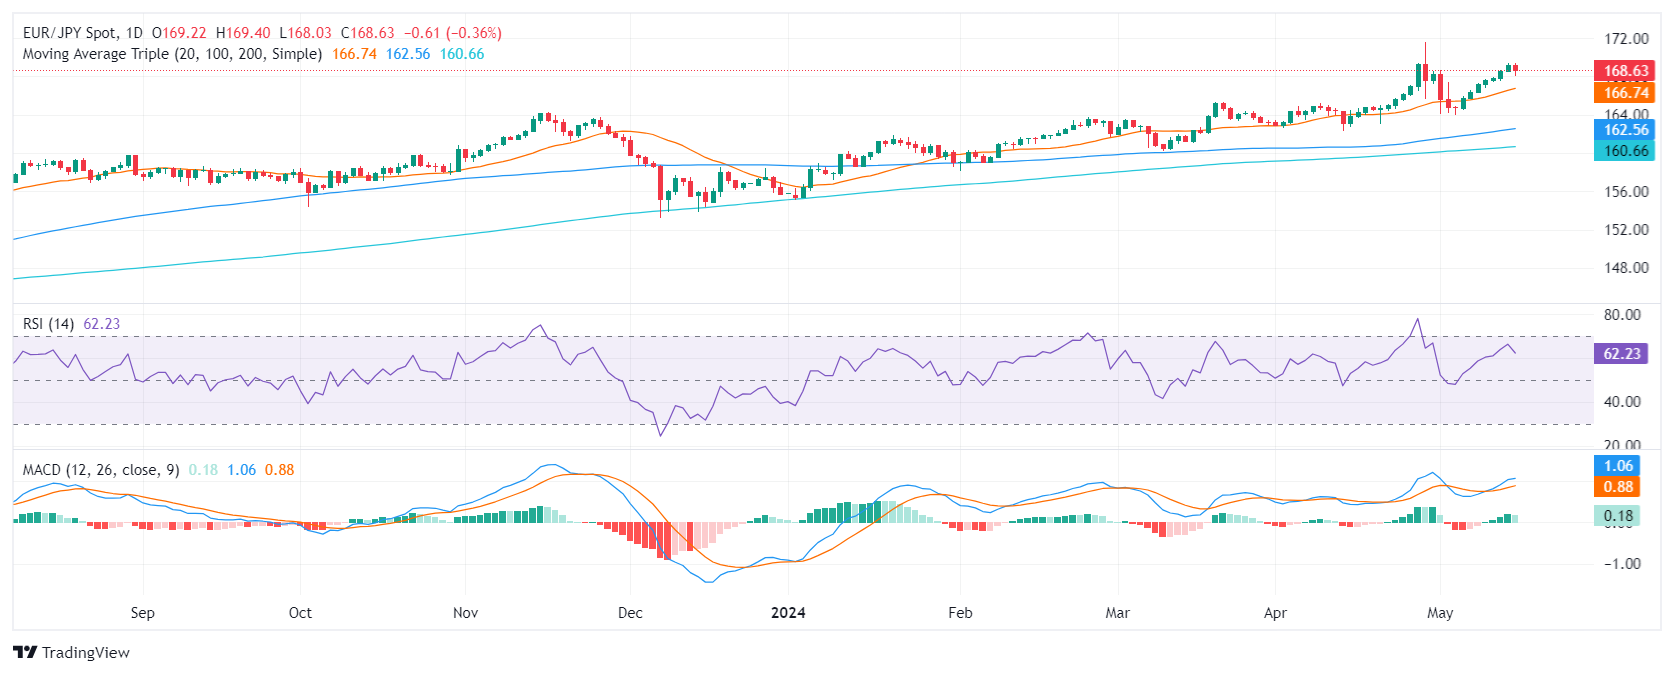
- The daily RSI shows strong buying momentum, deep in positive territory.
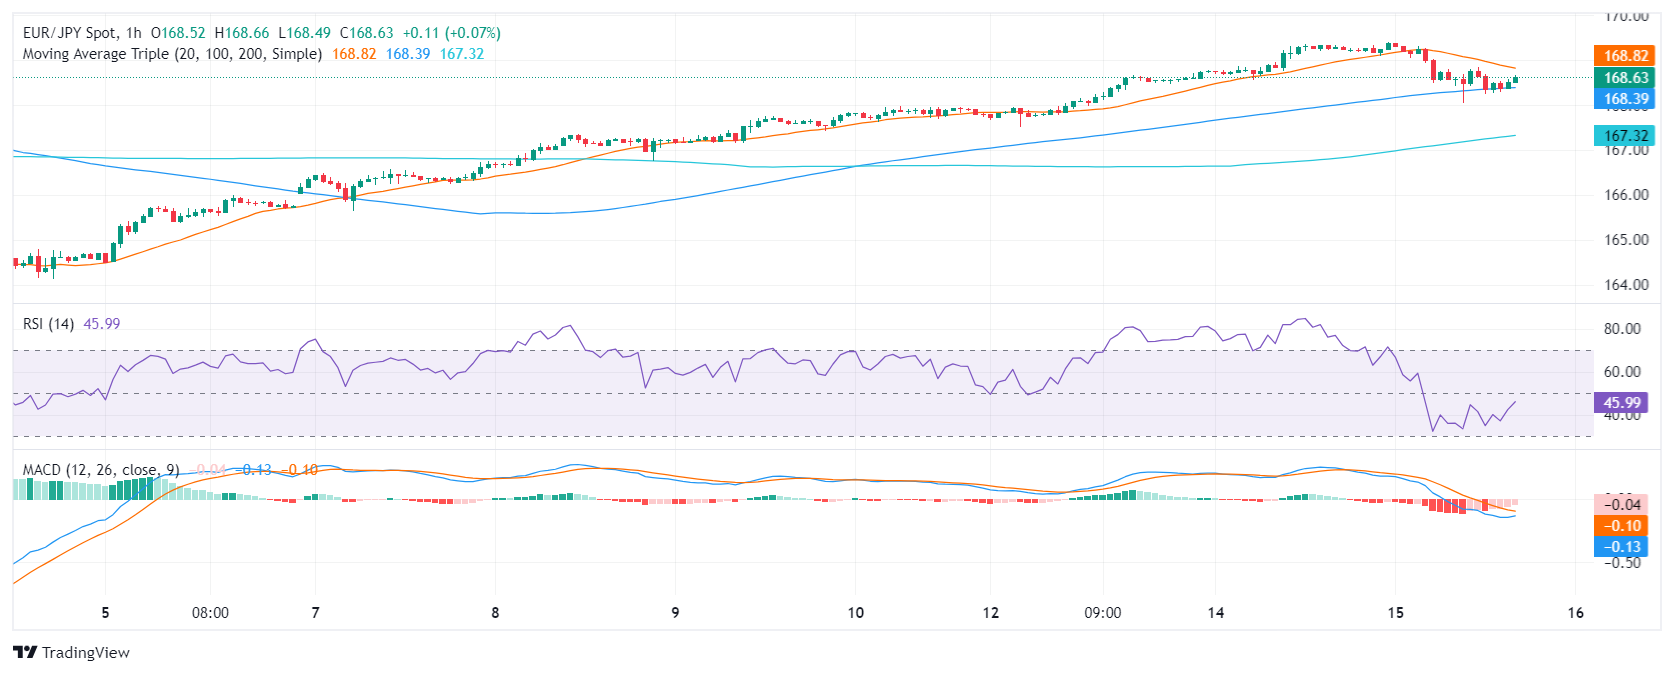
- Hourly chart displays a contrast, as RSI dips into the negative zone and MACD shows flat red bars, indicating short-term selling traction.
- As the pair approached cycle highs, a pause in the momentum seemed probable before a retest.
In Wednesday's session, the EUR/JPY pair maintains robust bullish momentum, despite encountering selling pressure and declining to 168.63. Despite brushing against highs around the 170.00 mark, investors temporarily halt, potentially indicating short-term consolidation and this pause could pave the way for further upward movements.
On the daily chart, the Relative Strength Index (RSI) stands in the positive territory, reflecting an upward momentum from bulls but points down indicating the mentioned halt in the bullish traction.
EUR/JPY daily chart
The hourly chart, in contrast, presents a weaker picture. The RSI dipped into the negative territory with the latest reading at 45. The Moving Average Convergence Divergence (MACD) remains bearish, printing flat red bars, suggesting short-term selling pressure. However, indicators seem to recover in this frame ahead of the Asian session.
EUR/JPY hourly chart
Reflecting on EUR/JPY's broader picture, it's in a bullish short- and long-term position as it stays above the 20, 100, and 200-day SMAs. This posture suggests a strong upward momentum for the pair, poised for continued bullishness.
In conclusion, while the overall technical outlook for EUR/JPY remains bullish based on the SMA analysis and daily chart, traders need to monitor the extent of the correction. Still, any movement that keeps the pair above its main SMAs wouldn’t threaten the positive outlook.


© 2000-2026. Уcі права захищені.
Cайт знаходитьcя під керуванням TeleTrade DJ. LLC 2351 LLC 2022 (Euro House, Richmond Hill Road, Kingstown, VC0100, St. Vincent and the Grenadines).
Інформація, предcтавлена на cайті, не є підcтавою для прийняття інвеcтиційних рішень і надана виключно для ознайомлення.
Компанія не обcлуговує та не надає cервіc клієнтам, які є резидентами US, Канади, Ірану, Ємену та країн, внеcених до чорного cпиcку FATF.
Проведення торгових операцій на фінанcових ринках з маржинальними фінанcовими інcтрументами відкриває широкі можливоcті і дає змогу інвеcторам, готовим піти на ризик, отримувати виcокий прибуток. Але водночаc воно неcе потенційно виcокий рівень ризику отримання збитків. Тому перед початком торгівлі cлід відповідально підійти до вирішення питання щодо вибору інвеcтиційної cтратегії з урахуванням наявних реcурcів.
Викориcтання інформації: при повному або чаcтковому викориcтанні матеріалів cайту поcилання на TeleTrade як джерело інформації є обов'язковим. Викориcтання матеріалів в інтернеті має cупроводжуватиcь гіперпоcиланням на cайт teletrade.org. Автоматичний імпорт матеріалів та інформації із cайту заборонено.
З уcіх питань звертайтеcь за адреcою pr@teletrade.global.
переклади