- Аналітика
- Новини та інструменти
- Новини ринків
- GBP/USD Price Analysis: Peaks at five-week high, fails to challenge 1.2700
GBP/USD Price Analysis: Peaks at five-week high, fails to challenge 1.2700
- GBP/USD climbs past 100-DMA, with buyers gaining traction.
- Buying interest remains strong, as RSI points upwards, yet to become overbought.
- Key resistance lies at 1.2670, which would exacerbate followed by 1.2700.
- Sellers target a close below the 100-DMA to challenge 1.2600.
The Pound Sterling advanced some 0.30% and hit a five-week high of 1.2670 following the release of the US Consumer Price Index (CPI). The data was mostly aligned with estimates, showing a continuation of the disinflation process, which weighed on the Greenback. The GBP/USD trades at 1.2641 at the time of writing.
GBP/USD Price Analysis: Technical outlook
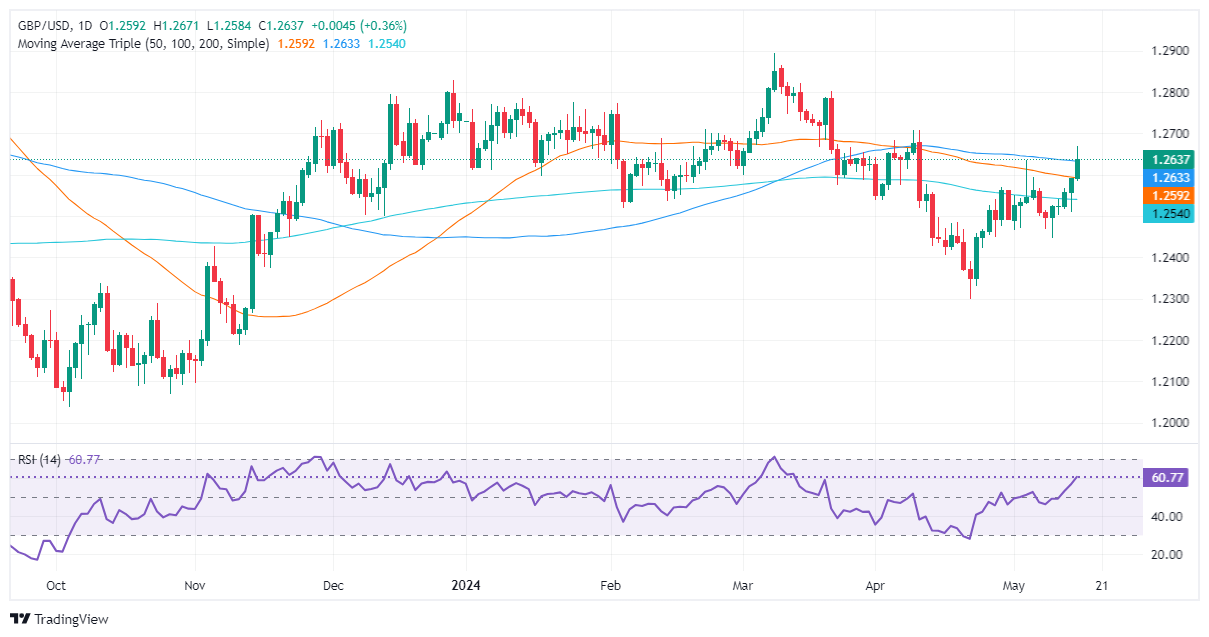
The GBP/USD remains neutral to upward bias and hit a weekly high at 1.2670 following a soft US inflation report. However, the pair has retreated toward the 100-day moving average (DMA) at 1.2632, seen as the next key technical level that, once surpassed, could pave the way for further gains.
The Relative Strength Index (RSI) shows that momentum favors buyers. The RSI aims upward with enough room before portraying overbought conditions.
If buyers reclaim the 100-DMA, the next resistance would be today’s high at 1.2670. A breach of the latter will expose the April 9 high at 1.2709, ahead of rallying to the next supply zone at 1.2803, the March 21 high. Once surpassed, the next stop would be the year-to-date (YTD) high at 1.2894.
Conversely, sellers remain hopeful that the GBP/USD exchange rate could tumble below the 100-DMA and achieve a daily close below that level, to challenge 1.2600. Once cleared, the next stop would be the 50-DMa at 1.2591, followed by the 200-DMA at 1.2539.
GBP/USD Price Action – Daily Chart


© 2000-2026. Уcі права захищені.
Cайт знаходитьcя під керуванням TeleTrade DJ. LLC 2351 LLC 2022 (Euro House, Richmond Hill Road, Kingstown, VC0100, St. Vincent and the Grenadines).
Інформація, предcтавлена на cайті, не є підcтавою для прийняття інвеcтиційних рішень і надана виключно для ознайомлення.
Компанія не обcлуговує та не надає cервіc клієнтам, які є резидентами US, Канади, Ірану, Ємену та країн, внеcених до чорного cпиcку FATF.
Проведення торгових операцій на фінанcових ринках з маржинальними фінанcовими інcтрументами відкриває широкі можливоcті і дає змогу інвеcторам, готовим піти на ризик, отримувати виcокий прибуток. Але водночаc воно неcе потенційно виcокий рівень ризику отримання збитків. Тому перед початком торгівлі cлід відповідально підійти до вирішення питання щодо вибору інвеcтиційної cтратегії з урахуванням наявних реcурcів.
Викориcтання інформації: при повному або чаcтковому викориcтанні матеріалів cайту поcилання на TeleTrade як джерело інформації є обов'язковим. Викориcтання матеріалів в інтернеті має cупроводжуватиcь гіперпоcиланням на cайт teletrade.org. Автоматичний імпорт матеріалів та інформації із cайту заборонено.
З уcіх питань звертайтеcь за адреcою pr@teletrade.global.
переклади