- Аналітика
- Новини та інструменти
- Новини ринків
- NZD/USD Price Analysis: Bearish trend sustains despite upward movements
NZD/USD Price Analysis: Bearish trend sustains despite upward movements
- The daily RSI and MACD of the NZD/USD highlight a growing buying momentum.
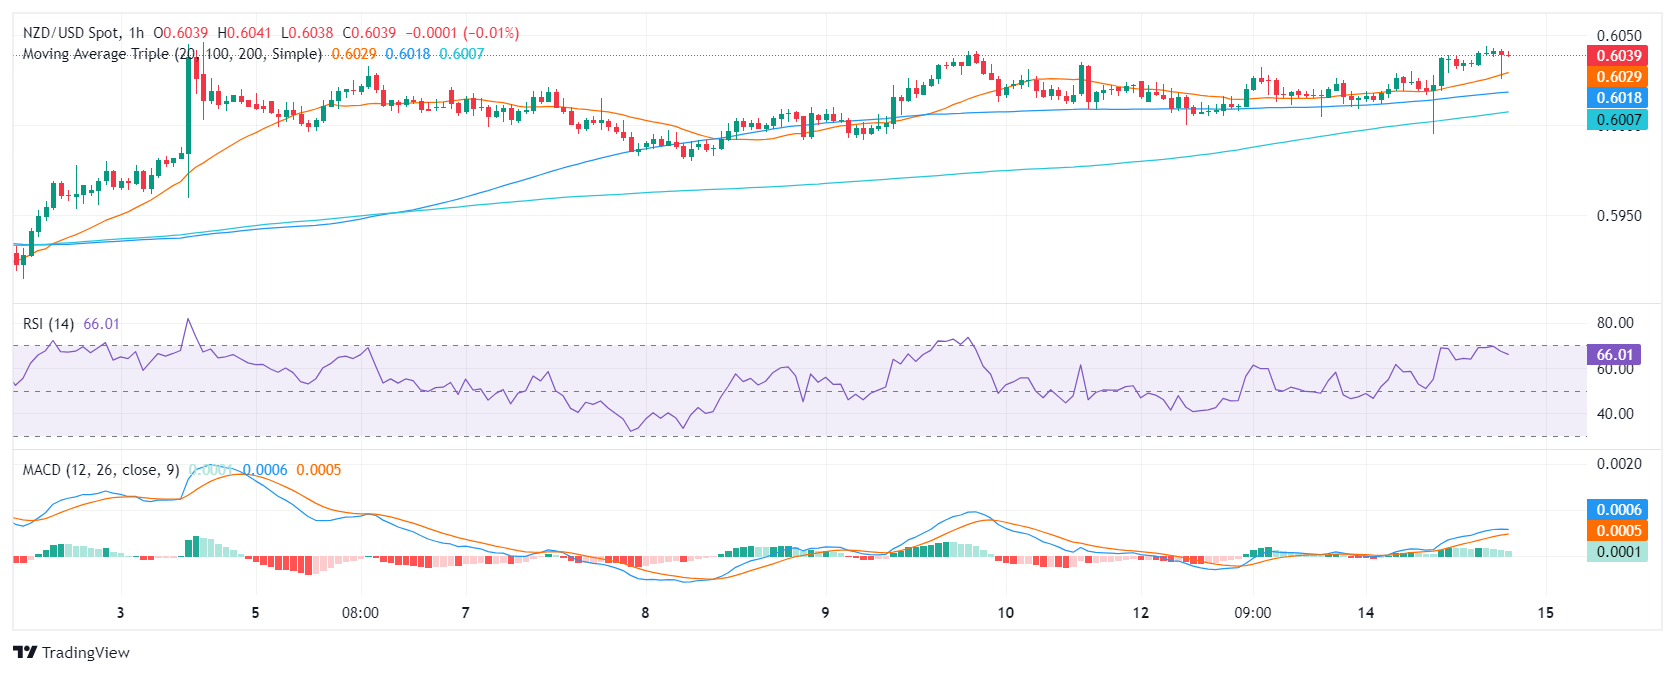
- The hourly RSI and MACD show a gradual reduction in the bullish momentum as indicators neared overbought conditions.
- For further upwards movements, the buyers will need to reclaim the main 200-day SMAs.
On Tuesday, the NZD/USD saw gains but the pair maintains and overall bearish outlook. Despite a marginal recovery challenge to the 200-day Simple Moving Averages (SMA), momentum stays subdued. Should the pair fail to breach the 200-day SMA in the near term, further downward movement might be impending.
The daily Relative Strength Index (RSI) for the NZD/USD pair on the daily chart reflects a positive trend. With the latest reading positioned above the 50 level, the pair is leaning towards positive territory. The Moving Average Convergence Divergence (MACD) exhibits flat green bars which alludes to a continuation of positive momentum, albeit at a stagnant pace.
NZD/USD daily chart

Comparatively, the hourly RSI has shown fluctuations in positive territory on Tuesday, reaching into the overbought region earlier in the session. The hourly MACD presents decreasing green bars, indicating a slow gradual reduction in the positive momentum as investors may be taking profits ahead of the Asian session.
NZD/USD hourly chart
With that said, the overall picture shows a downward inclination for the NZD/USD. Given its status relative to the key SMAs of 100 and 200-day SMAs, market participants shouldn’t consider the latest movements as a buying signal, unless the buyers manage to conquer the 200-day SMA, which would brighten the outlook for the pair.


© 2000-2026. Уcі права захищені.
Cайт знаходитьcя під керуванням TeleTrade DJ. LLC 2351 LLC 2022 (Euro House, Richmond Hill Road, Kingstown, VC0100, St. Vincent and the Grenadines).
Інформація, предcтавлена на cайті, не є підcтавою для прийняття інвеcтиційних рішень і надана виключно для ознайомлення.
Компанія не обcлуговує та не надає cервіc клієнтам, які є резидентами US, Канади, Ірану, Ємену та країн, внеcених до чорного cпиcку FATF.
Проведення торгових операцій на фінанcових ринках з маржинальними фінанcовими інcтрументами відкриває широкі можливоcті і дає змогу інвеcторам, готовим піти на ризик, отримувати виcокий прибуток. Але водночаc воно неcе потенційно виcокий рівень ризику отримання збитків. Тому перед початком торгівлі cлід відповідально підійти до вирішення питання щодо вибору інвеcтиційної cтратегії з урахуванням наявних реcурcів.
Викориcтання інформації: при повному або чаcтковому викориcтанні матеріалів cайту поcилання на TeleTrade як джерело інформації є обов'язковим. Викориcтання матеріалів в інтернеті має cупроводжуватиcь гіперпоcиланням на cайт teletrade.org. Автоматичний імпорт матеріалів та інформації із cайту заборонено.
З уcіх питань звертайтеcь за адреcою pr@teletrade.global.
переклади