- Аналітика
- Новини та інструменти
- Новини ринків
- EUR/JPY Price Analysis: Rallies for seventh straight day as bulls target 170.00
EUR/JPY Price Analysis: Rallies for seventh straight day as bulls target 170.00
- EUR/JPY edges up 0.44%, extending its winning streak to seven days amid positive market sentiment.
- Technical outlook remains bullish; RSI nears overbought territory, indicating strong upward momentum.
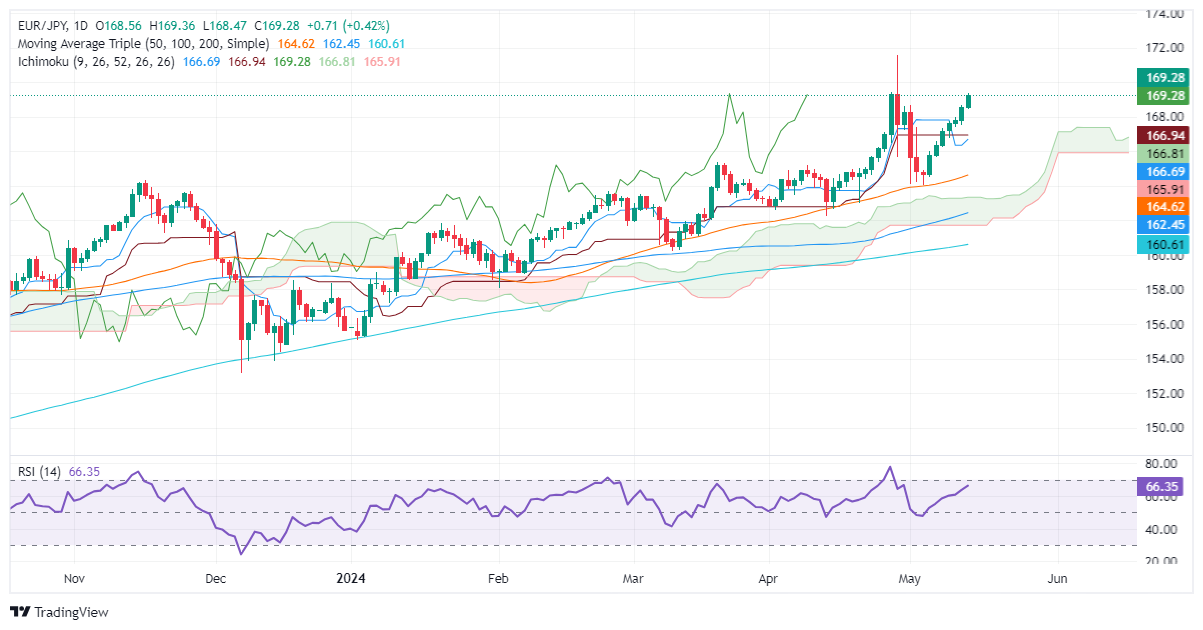
- Watch resistance at April’s 26 high of 169.39, 170.00, and YTD high at 171.58.
- Key support levels at 169.00, 166.93/81, and 165.90.
During the North American session, the Euro prolonged its gains versus the Japanese Yen in late trading. Market sentiment remains upbeat; hence, the EUR/JPY trades with gains of 0.44%, at 169.27 at the time of writing.
EUR/JPY Price Analysis: Technical outlook
From a technical perspective, the EUR/JPY remains upward biased, extending its gains for seven straight days, whereas fears that Japanese authorities could intervene in the Forex markets can limit the upside.
Momentum remains favoring the uptrend, as the Relative Strength Index is in bullish territory and about to become overbought. However, due to the strength of the uptrend, the most extreme level wouldn’t be 70, as most traders would use 80.
With that said, the first key resistance level would be the April 26 high at 169.39. Once surpassed, sellers' next line of defense would be the 170.00 figure, followed by the year-to-date (YTD) high at 171.58.
Conversely, if EUR/JPY retreats and dives below 169.00, that could exert downward pressure on the cross. The first support level would be the confluence of the Kijun-Sen and the Senkou Span A at around 166.93/81, followed by the Tenkan-Sen at 166.68. A breach of the latter will expose the Senkou Span B at 165.90.
EUR/JPY Price Action – Daily Chart


© 2000-2026. Уcі права захищені.
Cайт знаходитьcя під керуванням TeleTrade DJ. LLC 2351 LLC 2022 (Euro House, Richmond Hill Road, Kingstown, VC0100, St. Vincent and the Grenadines).
Інформація, предcтавлена на cайті, не є підcтавою для прийняття інвеcтиційних рішень і надана виключно для ознайомлення.
Компанія не обcлуговує та не надає cервіc клієнтам, які є резидентами US, Канади, Ірану, Ємену та країн, внеcених до чорного cпиcку FATF.
Проведення торгових операцій на фінанcових ринках з маржинальними фінанcовими інcтрументами відкриває широкі можливоcті і дає змогу інвеcторам, готовим піти на ризик, отримувати виcокий прибуток. Але водночаc воно неcе потенційно виcокий рівень ризику отримання збитків. Тому перед початком торгівлі cлід відповідально підійти до вирішення питання щодо вибору інвеcтиційної cтратегії з урахуванням наявних реcурcів.
Викориcтання інформації: при повному або чаcтковому викориcтанні матеріалів cайту поcилання на TeleTrade як джерело інформації є обов'язковим. Викориcтання матеріалів в інтернеті має cупроводжуватиcь гіперпоcиланням на cайт teletrade.org. Автоматичний імпорт матеріалів та інформації із cайту заборонено.
З уcіх питань звертайтеcь за адреcою pr@teletrade.global.
переклади