- Аналітика
- Новини та інструменти
- Новини ринків
- NZD/USD Price Analysis: Bears tighten their grip and present battle at around 0.6000
NZD/USD Price Analysis: Bears tighten their grip and present battle at around 0.6000
- The daily RSI and MACD indicate diminishing buying momentum as bulls struggle to gain further ground.
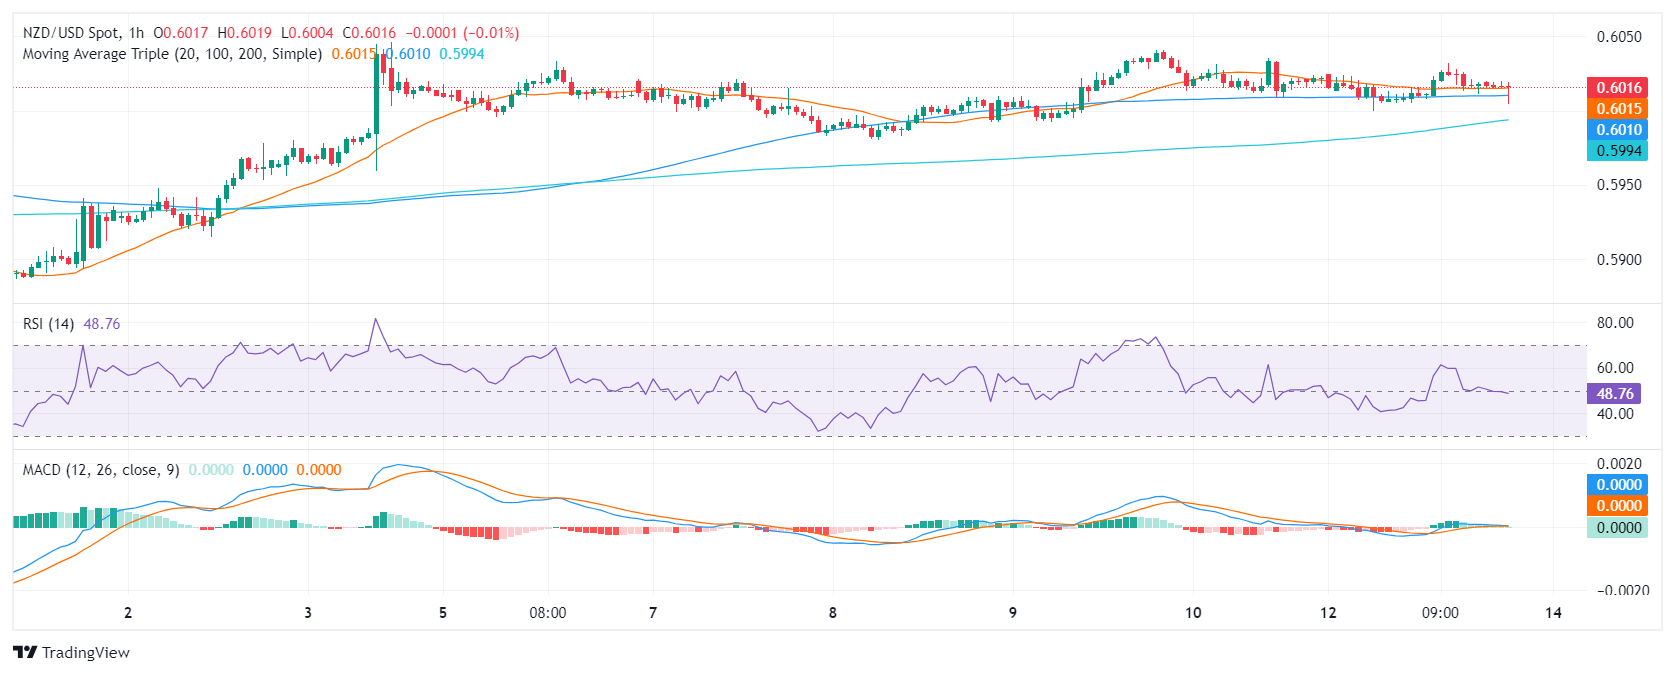
- The hourly indicators reveal that sellers have a slight upper hand ahead of the Asian session.
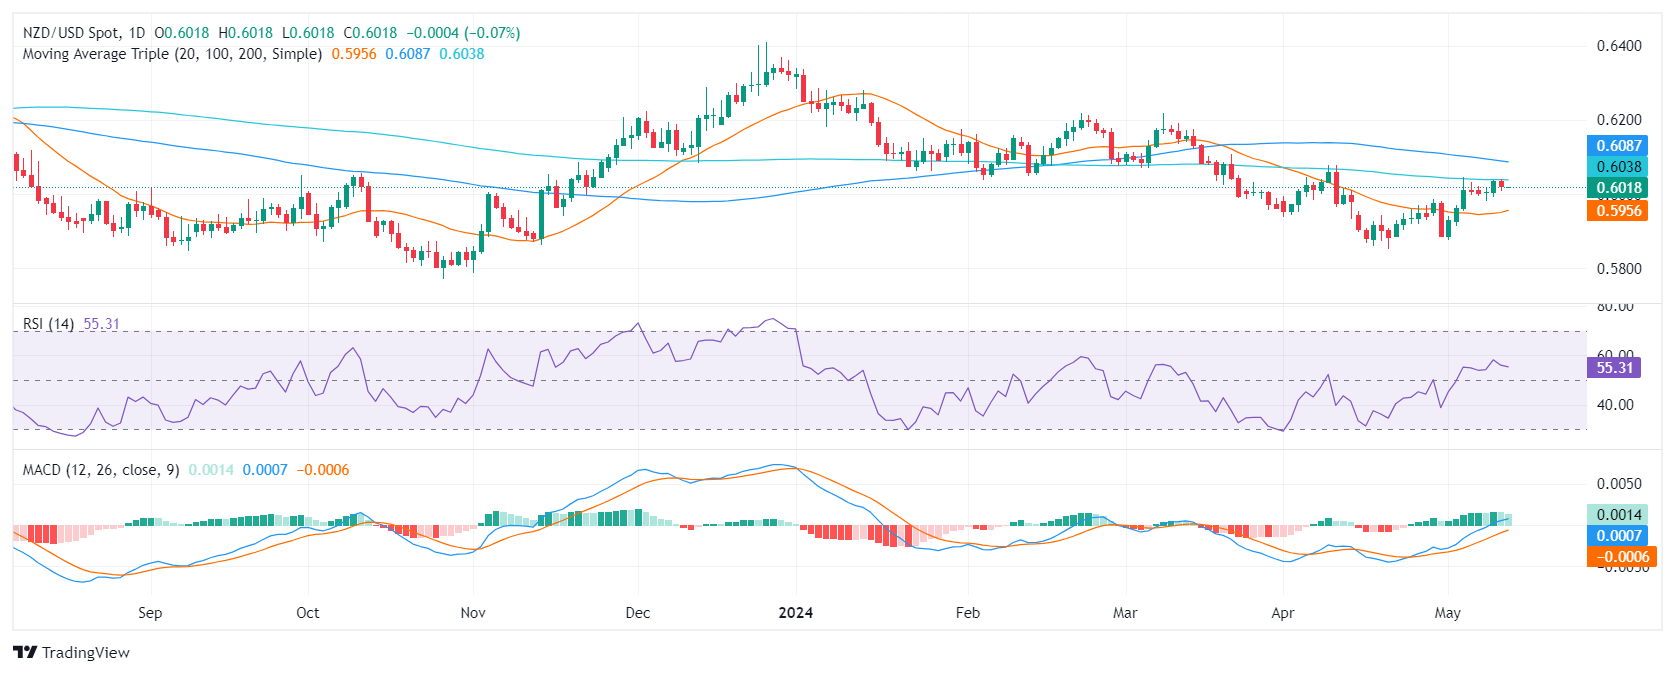
In Monday's session, the NZD/USD pair traded with mild losses, and sellers gained ground. As the pair is facing strong resistance at the 200-day Simple Moving Average (SMA), the pair struggles to consolidate advances. Indicators are flattening and indicate that the moment of the bulls may be coming to an end.
On the daily chart, the Relative Strength Index (RSI) shows a flattening traction above 50. At the same time, the Moving Average Convergence Divergence (MACD) histogram reveals a decrease in buying momentum, demonstrated by diminishing green bars.
NZD/USD daily chart
The hourly RSI indicates a slightly negative trend with the latest reading falling towards its middlepoint, showing a slight dominance from the sellers in the market. This is supported by the MACD, which also prints decreasing green bars, further confirming the decrease in buying momentum at an intraday level.
NZD/USD hourly chart
Interpreting the broader perspective, the NZD/USD is positioned below the thresholds of its 100, 200-day Simple Moving Averages (SMA). Significant bearish momentum, implying a prevailing downward trend in both the medium and long term. However, if the buyers defend the 20-day SMA, they may still have some hope to make another stride to reclaim the 200-day SMA.4


© 2000-2026. Уcі права захищені.
Cайт знаходитьcя під керуванням TeleTrade DJ. LLC 2351 LLC 2022 (Euro House, Richmond Hill Road, Kingstown, VC0100, St. Vincent and the Grenadines).
Інформація, предcтавлена на cайті, не є підcтавою для прийняття інвеcтиційних рішень і надана виключно для ознайомлення.
Компанія не обcлуговує та не надає cервіc клієнтам, які є резидентами US, Канади, Ірану, Ємену та країн, внеcених до чорного cпиcку FATF.
Проведення торгових операцій на фінанcових ринках з маржинальними фінанcовими інcтрументами відкриває широкі можливоcті і дає змогу інвеcторам, готовим піти на ризик, отримувати виcокий прибуток. Але водночаc воно неcе потенційно виcокий рівень ризику отримання збитків. Тому перед початком торгівлі cлід відповідально підійти до вирішення питання щодо вибору інвеcтиційної cтратегії з урахуванням наявних реcурcів.
Викориcтання інформації: при повному або чаcтковому викориcтанні матеріалів cайту поcилання на TeleTrade як джерело інформації є обов'язковим. Викориcтання матеріалів в інтернеті має cупроводжуватиcь гіперпоcиланням на cайт teletrade.org. Автоматичний імпорт матеріалів та інформації із cайту заборонено.
З уcіх питань звертайтеcь за адреcою pr@teletrade.global.
переклади