- Аналітика
- Новини та інструменти
- Новини ринків
- EUR/JPY Price Analysis: Bulls maintain momentum, potential short-term pullbacks on the horizon
EUR/JPY Price Analysis: Bulls maintain momentum, potential short-term pullbacks on the horizon
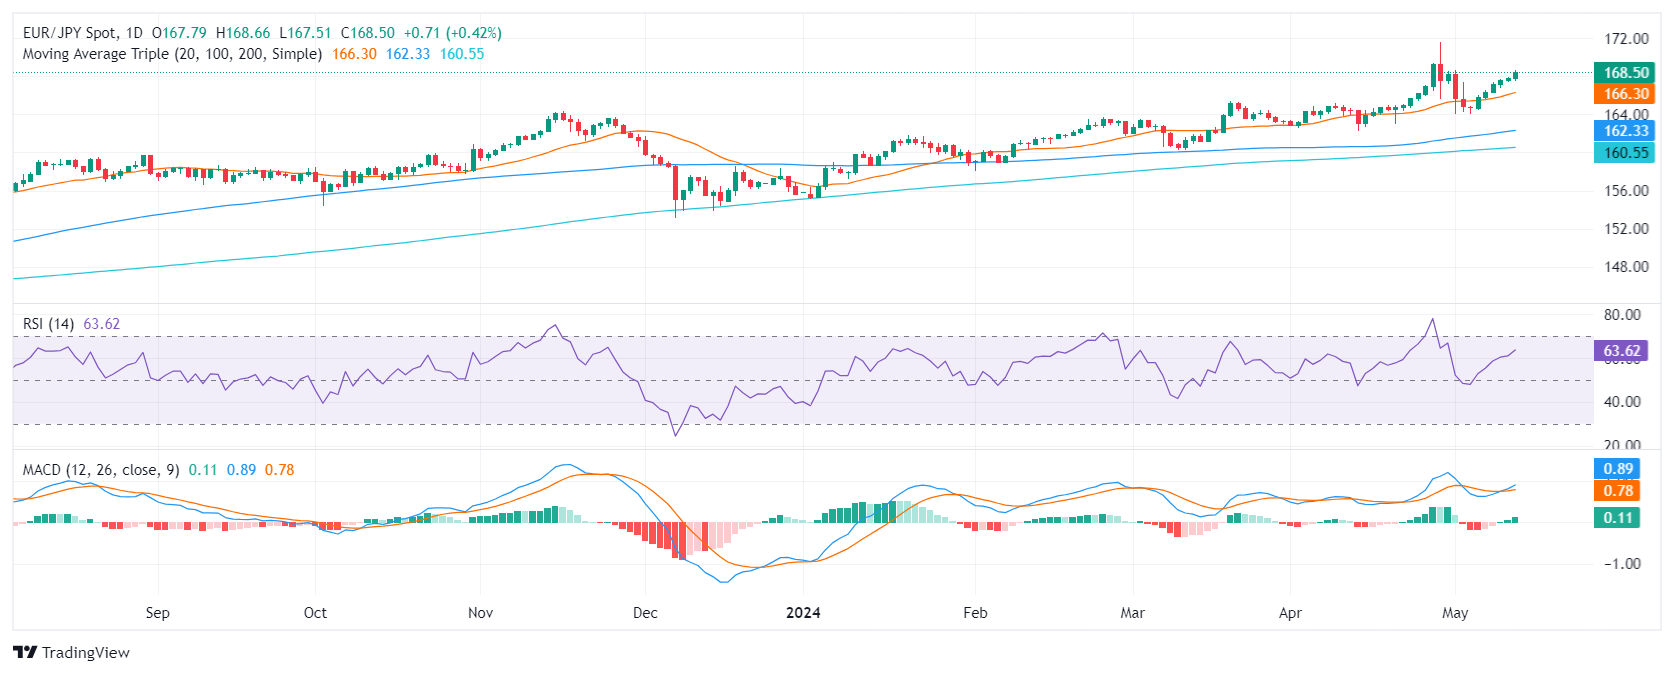
- The daily chart of the EUR/JPY reveals strong buying momentum, backed by positive RSI and MACD readings.
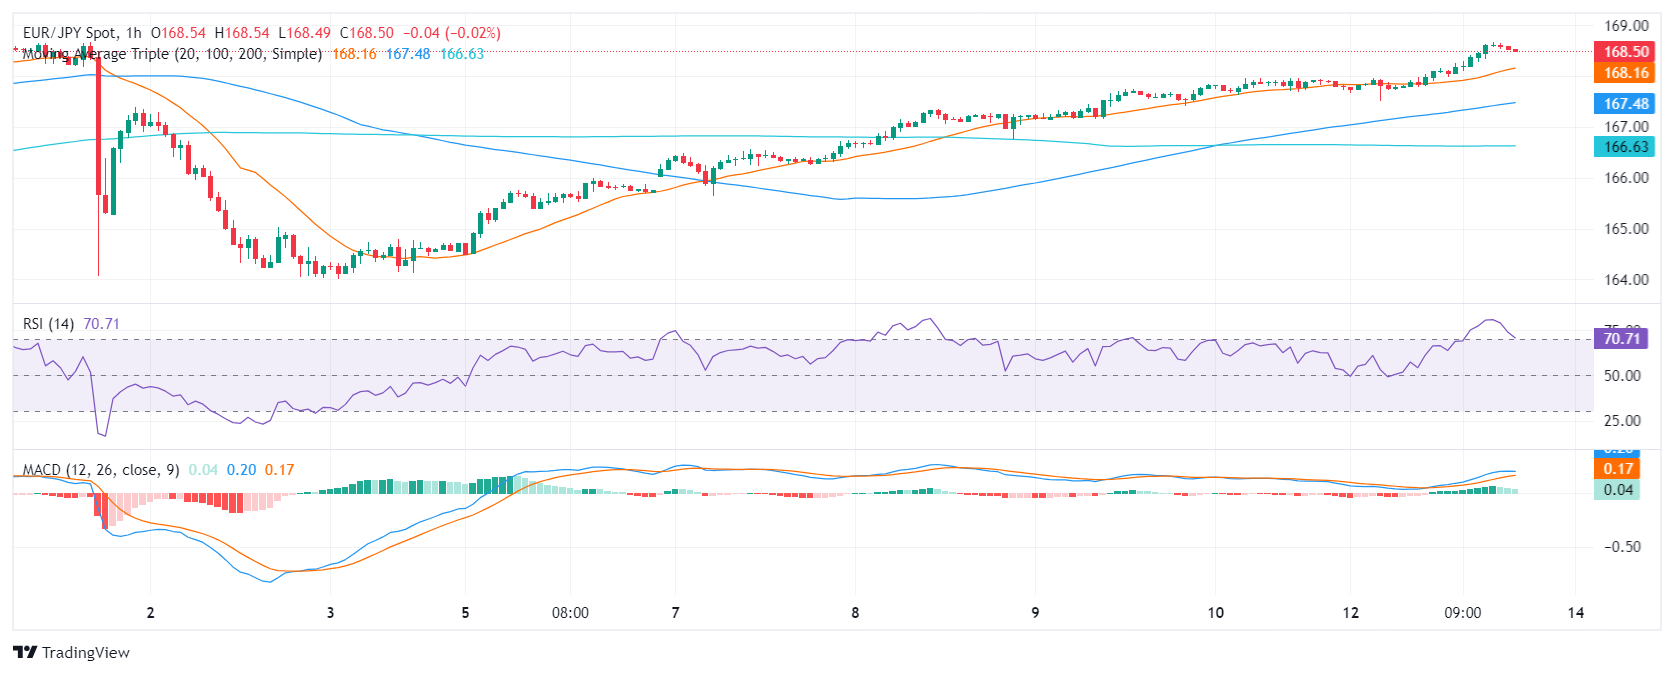
- Hourly chart indicators show a possible easing off from overbought status, potentially hinting at a nearing correction.
In Monday's session, the EUR/JPY pair showed strong bullish momentum, registering a rise to 168.52, marking a favorable 0.45% shift. However, potential short-term wavering observed in the hourly chart's indicators, suggests an approaching cooling-off phase, which could lead to profit-taking. As the ascent continues, investors are monitoring for a possible retest of the cycle highs above 170.00 in future sessions.
On the daily chart, the Relative Strength Index (RSI) is situated within the positive territory, signaling a buying bias. The consistent upward movement of the RSI, especially its peak at approximately 63, indicates strong buying momentum. Concurrently, the Moving Average Convergence Divergence (MACD) histogram shows increasing green bars, reinforcing the bullish outlook.
EUR/JPY daily chart
Moving to the hourly chart, the RSI shows heightened levels, consistently breaching the overbought threshold. A notable drop from approximately 80 to around 70 level, however, suggests a possible easing off from overbought status. Complementarily, the MACD on the hourly chart registers reducing green bars, implying a slowing pace of buying activity.
EUR/JPY hourly chart
Assessing the overall scenario, the EUR/JPY remains resilient around its Simple Moving Average (SMA) clusters. The pair is above the 20, 100, and 200-day SMA, important short- and long-term trend indicators, signifying a potential bullish bias in the near-term outlook. In addition, the pair being close to multi-year highs also paints with green the overall outlook.


© 2000-2026. Уcі права захищені.
Cайт знаходитьcя під керуванням TeleTrade DJ. LLC 2351 LLC 2022 (Euro House, Richmond Hill Road, Kingstown, VC0100, St. Vincent and the Grenadines).
Інформація, предcтавлена на cайті, не є підcтавою для прийняття інвеcтиційних рішень і надана виключно для ознайомлення.
Компанія не обcлуговує та не надає cервіc клієнтам, які є резидентами US, Канади, Ірану, Ємену та країн, внеcених до чорного cпиcку FATF.
Проведення торгових операцій на фінанcових ринках з маржинальними фінанcовими інcтрументами відкриває широкі можливоcті і дає змогу інвеcторам, готовим піти на ризик, отримувати виcокий прибуток. Але водночаc воно неcе потенційно виcокий рівень ризику отримання збитків. Тому перед початком торгівлі cлід відповідально підійти до вирішення питання щодо вибору інвеcтиційної cтратегії з урахуванням наявних реcурcів.
Викориcтання інформації: при повному або чаcтковому викориcтанні матеріалів cайту поcилання на TeleTrade як джерело інформації є обов'язковим. Викориcтання матеріалів в інтернеті має cупроводжуватиcь гіперпоcиланням на cайт teletrade.org. Автоматичний імпорт матеріалів та інформації із cайту заборонено.
З уcіх питань звертайтеcь за адреcою pr@teletrade.global.
переклади