- Аналітика
- Новини та інструменти
- Новини ринків
- USD/NOK trades mildly lower after Norwegian CPI data
USD/NOK trades mildly lower after Norwegian CPI data
- Despite hot inflation readings from Norway, the Fed’s hawkish stance limits the downside.
- Markets are gearing up for next week’s US CPI reading which may likely set the pace of the pair.
The USD/NOK pair is trading with mild losses around 10.85. The Federal Reserve's (Fed) hawkish approach seems to be aiding the USD, while strong economic recovery signals in Norway aren't offsetting this impact on the NOK. As the American calendar remains empty, all eyes are on next week’s Consumer Price Index (CPI) report from April from the US.
Norway's April CPI showed that the headline number rose to 3.6% year-on-year, which was slightly higher than anticipated, although it showed a slight drop from March's 3.9%. Meanwhile, the underlying inflation rate surprised by coming in at 4.4% year-on-year, two ticks higher than expected, and up from March's 4.5%.
Last week, the Norges Bank opted to maintain rates at 4.5% and highlighted the possibility of needing to sustain a tight monetary policy stance for a longer duration than previously anticipated, citing the current data trends. Markets are expecting only 50 bps of easing in the next 12 months.
On the US side, US Fed officials are keeping the hawkish bets steady and as for now, investors are delaying the start of the easing cycle to September.
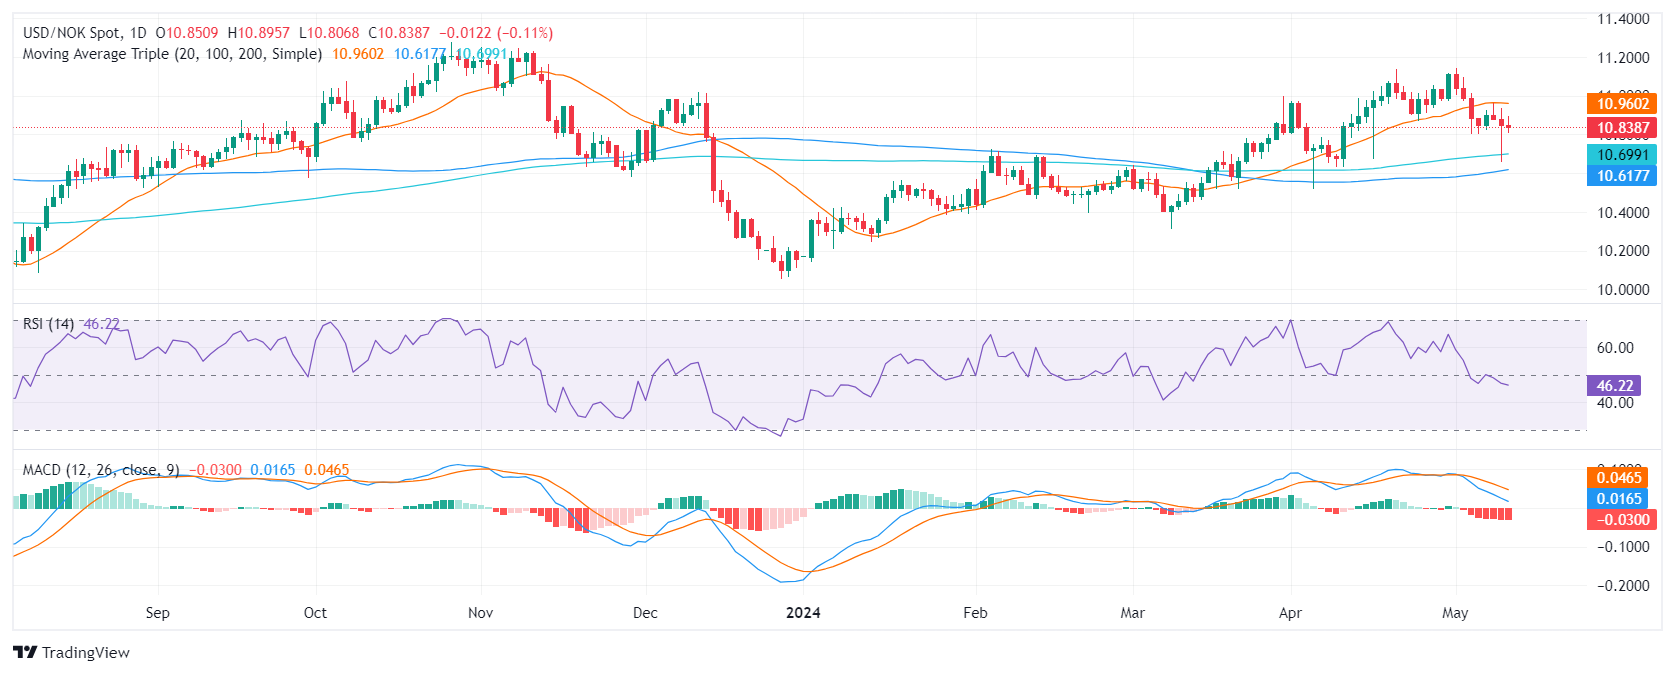
USD/NOK technical analysis
The daily Relative Strength Index (RSI) for the USD/NOK pair remains largely within the negative territory. Today's reading is at 46.66, which suggests a somewhat bearish short-term outlook. Due to its fluctuation, with an initial high near-overbought conditions and a subsequent drop, the RSI indicates the potential for bearish pressure. However, the consistent presence within the negative territory also warns of a continuous downtrend possibility.
Simultaneously, the Moving Average Convergence Divergence (MACD) histogram strengthens this view. Rising red bars signify an increasing negative momentum, with sellers gaining a more dominant position in the market.
USD/NOK technical analysis
Upon evaluation of the bigger picture, the USD/NOK chart exhibits a strong stance above the 20, 100, and 200-day Simple Moving Averages (SMAs). As the pair trades above these key moving averages, it indicates a bullish long-term trend, considering both minor and major aspects. However, given the significant trading above these levels, traders should be mindful of the potential pullback risks, which could provide possible buying opportunities.
In conclusion, despite a bearish short-term view provided by the daily RSI and MACD indicators, the placement above the SMAs suggests an overall bullish trajectory for the USD/NOK pair. Caution is warranted due to possible volatility and the likelihood of pullbacks, hence the need for continuous monitoring of market trends and indicators.
USD/NOK daily chart


© 2000-2026. Уcі права захищені.
Cайт знаходитьcя під керуванням TeleTrade DJ. LLC 2351 LLC 2022 (Euro House, Richmond Hill Road, Kingstown, VC0100, St. Vincent and the Grenadines).
Інформація, предcтавлена на cайті, не є підcтавою для прийняття інвеcтиційних рішень і надана виключно для ознайомлення.
Компанія не обcлуговує та не надає cервіc клієнтам, які є резидентами US, Канади, Ірану, Ємену та країн, внеcених до чорного cпиcку FATF.
Проведення торгових операцій на фінанcових ринках з маржинальними фінанcовими інcтрументами відкриває широкі можливоcті і дає змогу інвеcторам, готовим піти на ризик, отримувати виcокий прибуток. Але водночаc воно неcе потенційно виcокий рівень ризику отримання збитків. Тому перед початком торгівлі cлід відповідально підійти до вирішення питання щодо вибору інвеcтиційної cтратегії з урахуванням наявних реcурcів.
Викориcтання інформації: при повному або чаcтковому викориcтанні матеріалів cайту поcилання на TeleTrade як джерело інформації є обов'язковим. Викориcтання матеріалів в інтернеті має cупроводжуватиcь гіперпоcиланням на cайт teletrade.org. Автоматичний імпорт матеріалів та інформації із cайту заборонено.
З уcіх питань звертайтеcь за адреcою pr@teletrade.global.
переклади