- Аналітика
- Новини та інструменти
- Новини ринків
- NZD/USD Price Analysis: Bearish momentum escalates, buyers struggle to hold ground
NZD/USD Price Analysis: Bearish momentum escalates, buyers struggle to hold ground
- The NZD/USD exhibits a bearish trend with growing selling pressure, accentuated by the stiff resistance at the 0.6040 level.
- Indicators are flattening on the daily chart as bulls are running out of steam.
The NZD/USD stands at 0.6005 seeing mild losses in Tuesday’s session. Market movements highlight strong bearish momentum following consecutive losing sessions. The overall trend reveals strengthening selling pressure, with the NZD/USD facing considerable resistance at the 0.6040-50 level. This suggests a potential continuation of the downward trend as sellers assert their market dominance and bulls struggle to gain further ground.
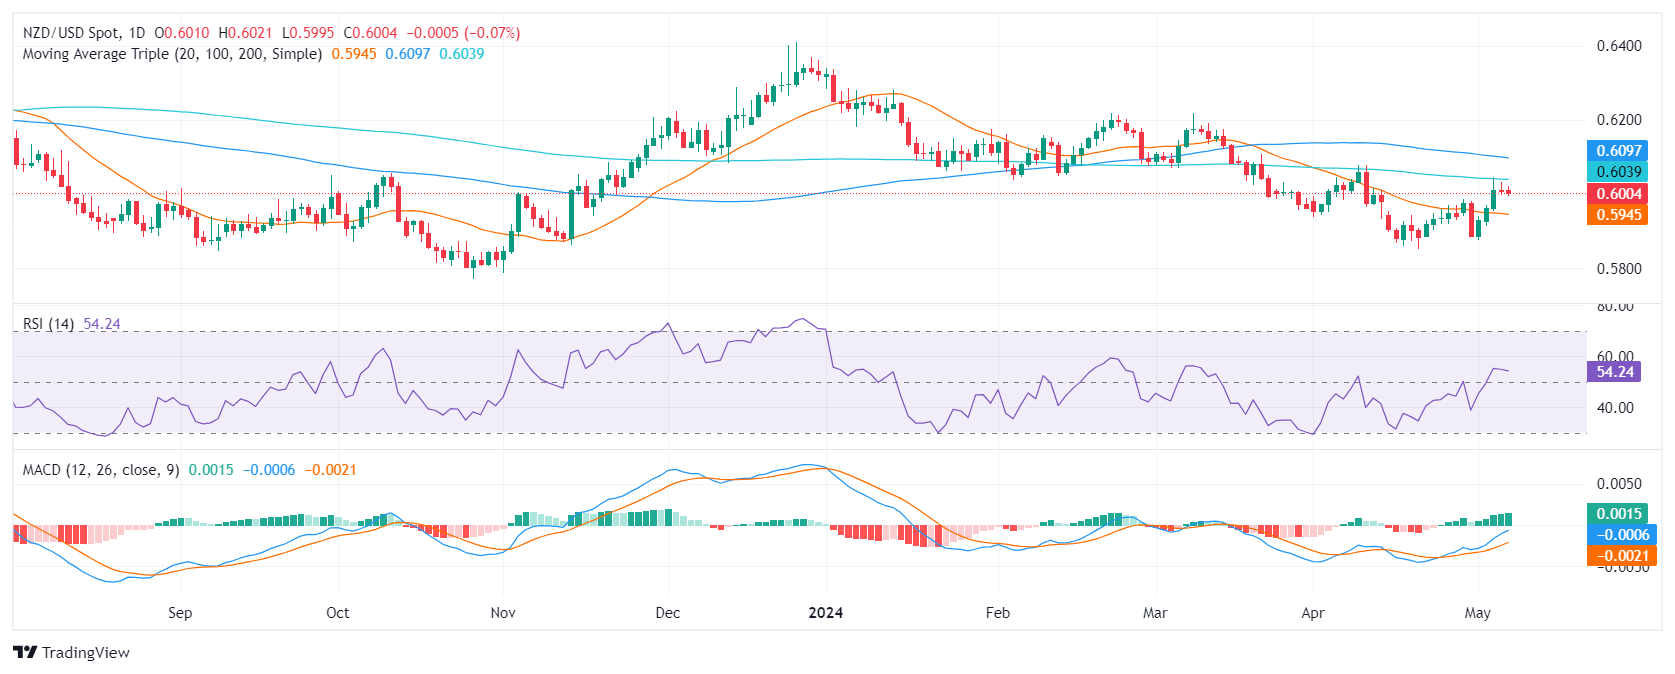
On the daily chart, the Relative Strength Index (RSI) for NZD/USD exhibits a recovery trend shifting from negative to positive territory. This trajectory indicates a gradual increase in buying interest but seems to have flattened. However, the Moving Average Convergence Divergence (MACD) histogram remains flat, reflecting stabilized momentum that does not favor either buyers or sellers dominantly.
NZD/USD daily chart
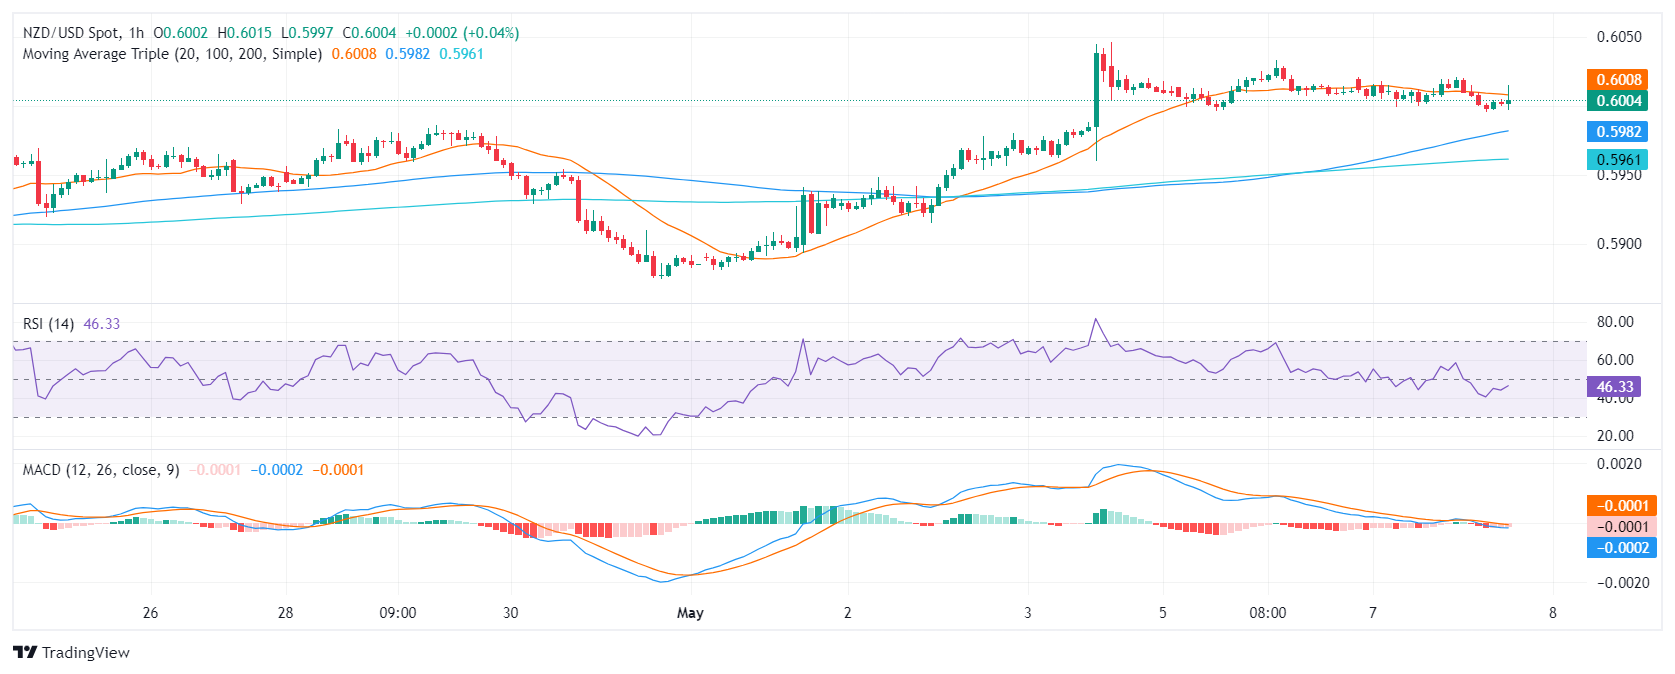
Shifting attention to the hourly chart, the NZD/USD pair presents a different narrative. The RSI flutters around in negative territory, showing sellers have a short-term advantage. Notably, the hourly MACD histogram presents flat red bars indicative of negative momentum persisting throughout the session.
NZD/USD hourly chart
In the grand scope, the mounting seller dominance is underscored by the NZD/USD's struggle to pierce the 200-day Simple Moving Average (SMA) at the 0.6040 level. This signifies a crucial resistance point for the pair. If the inability to break through persists, it could certainly reinforce the bearish trajectory in the next sessions. However, as long as the bulls hold above the 20-day SMA, the short-term outlook will remain tilted with some green.


© 2000-2026. Уcі права захищені.
Cайт знаходитьcя під керуванням TeleTrade DJ. LLC 2351 LLC 2022 (Euro House, Richmond Hill Road, Kingstown, VC0100, St. Vincent and the Grenadines).
Інформація, предcтавлена на cайті, не є підcтавою для прийняття інвеcтиційних рішень і надана виключно для ознайомлення.
Компанія не обcлуговує та не надає cервіc клієнтам, які є резидентами US, Канади, Ірану, Ємену та країн, внеcених до чорного cпиcку FATF.
Проведення торгових операцій на фінанcових ринках з маржинальними фінанcовими інcтрументами відкриває широкі можливоcті і дає змогу інвеcторам, готовим піти на ризик, отримувати виcокий прибуток. Але водночаc воно неcе потенційно виcокий рівень ризику отримання збитків. Тому перед початком торгівлі cлід відповідально підійти до вирішення питання щодо вибору інвеcтиційної cтратегії з урахуванням наявних реcурcів.
Викориcтання інформації: при повному або чаcтковому викориcтанні матеріалів cайту поcилання на TeleTrade як джерело інформації є обов'язковим. Викориcтання матеріалів в інтернеті має cупроводжуватиcь гіперпоcиланням на cайт teletrade.org. Автоматичний імпорт матеріалів та інформації із cайту заборонено.
З уcіх питань звертайтеcь за адреcою pr@teletrade.global.
переклади