- Аналітика
- Новини та інструменти
- Новини ринків
- EUR/GBP Price Analysis: Continues oscillating within a range – currently falling
EUR/GBP Price Analysis: Continues oscillating within a range – currently falling
- EUR/GBP price has just reversed lower after rising up to near the range highs.
- The sideways trend is likely to extend, with price oscillating within the range.
- EUR/GBP is currently finding support from a cluster of major Moving Averages in the 0.8560s.
EUR/GBP price is trading in the 0.8560s, in the middle of a multi-month range on Monday. It moved lower after rising up to close to the range ceiling.
The pair is in a sideways trend which is expected to extend given the old traders adage that “the trend is your friend”.
EUR/GBP 4-hour Chart
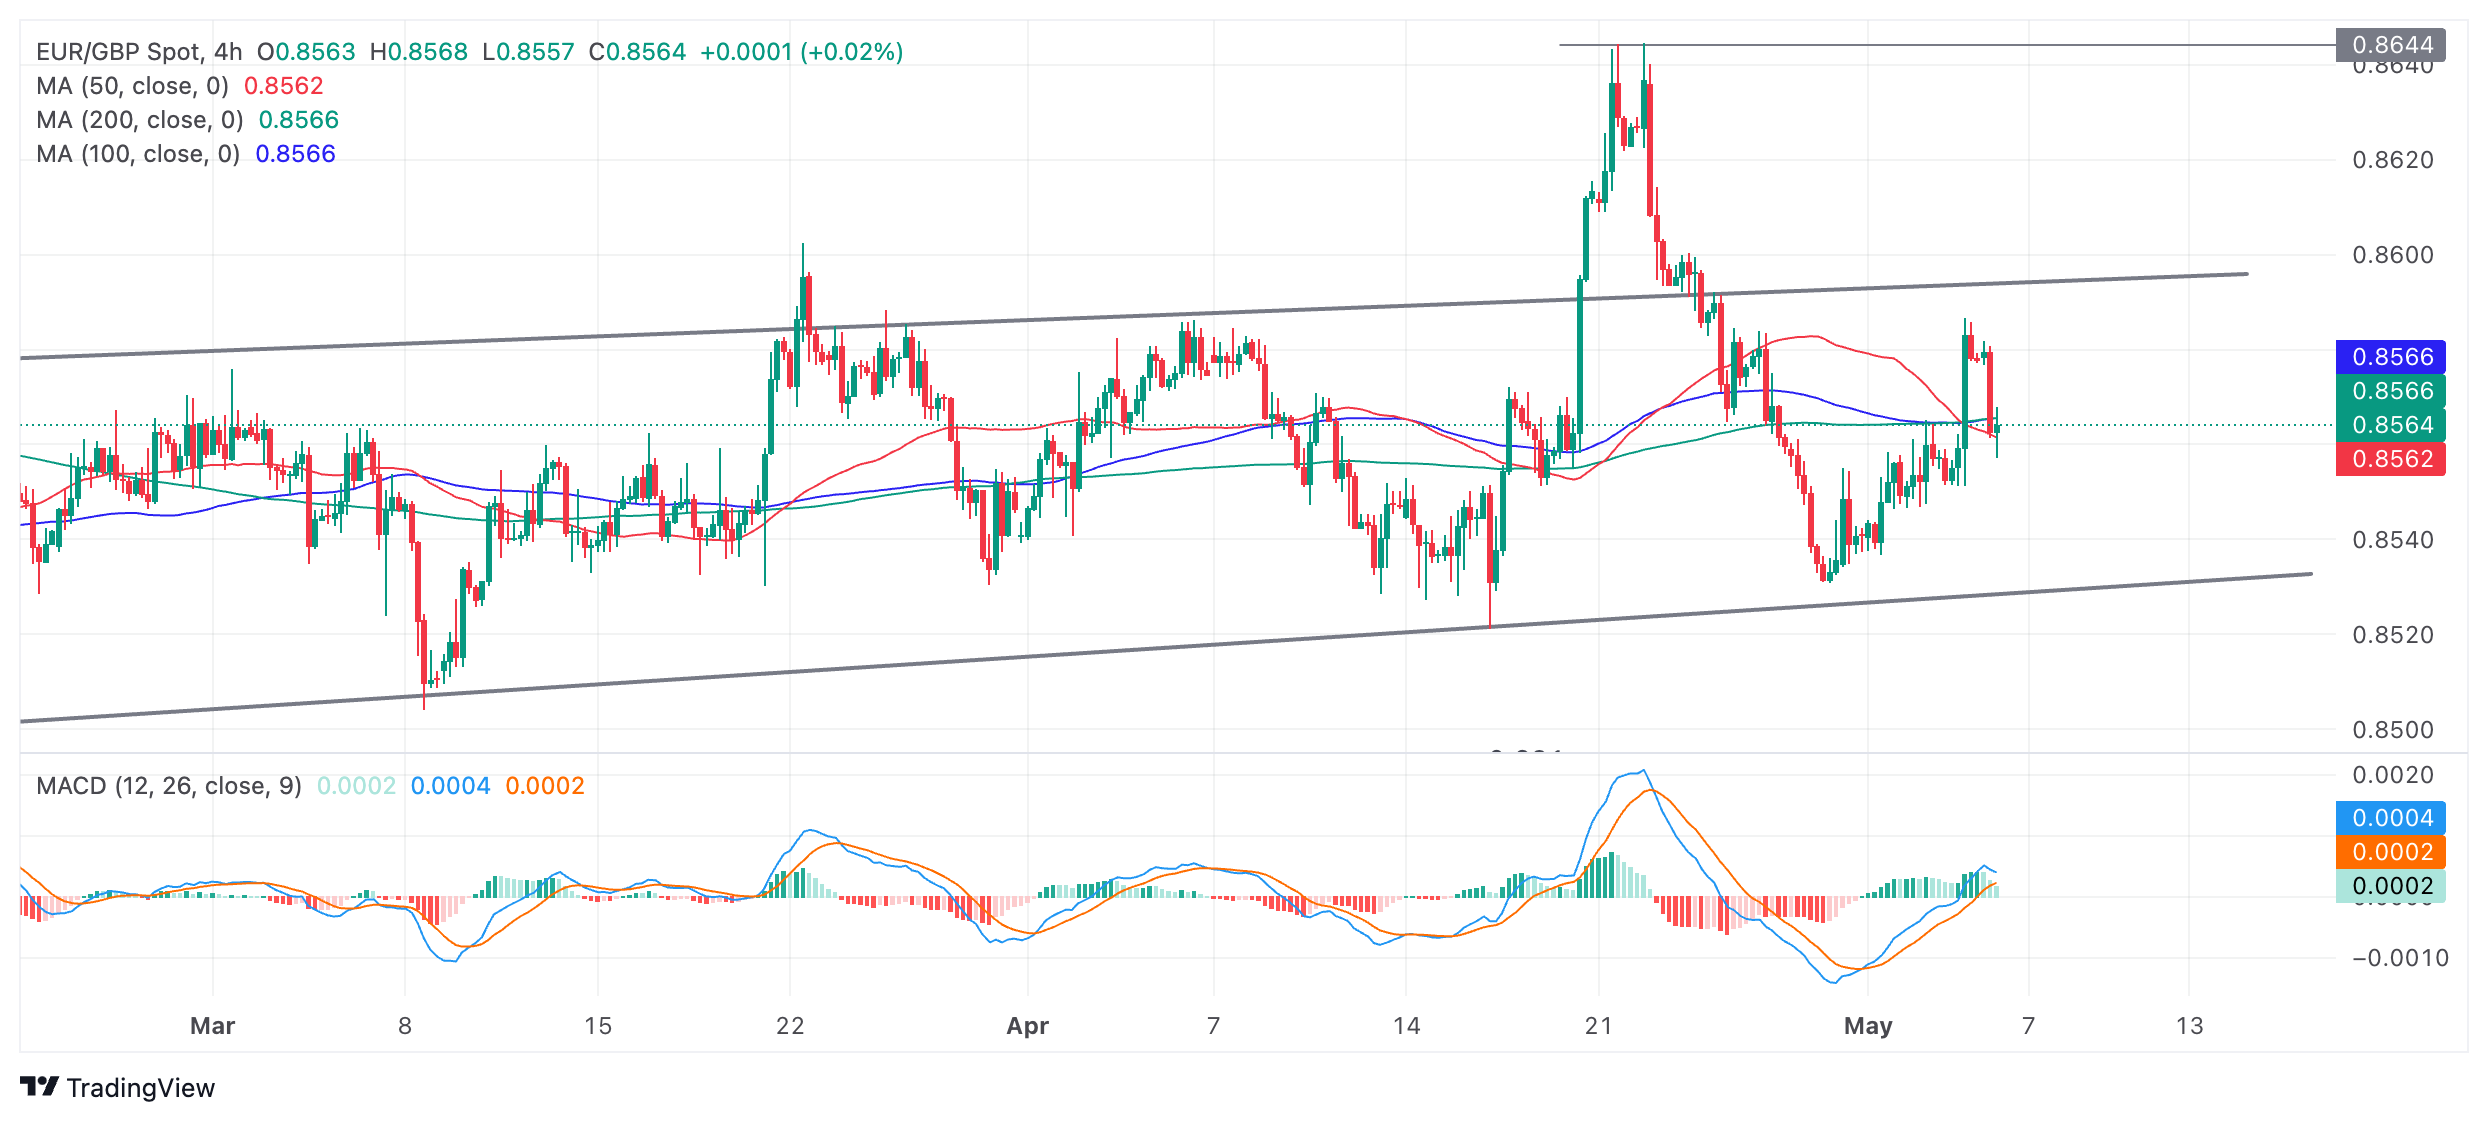
After rising up and almost touching the top of the range on Friday, EUR/GBP reversed and has fallen to a cluster of MAs at 0.8565, where it has temporarily found support. If the pair can decisively break below this cluster of MAs which is made up of the 50, 100 and 200 Simple Moving Averages (SMA) it will probably fall back down to support at 0.8530.
The Moving Average Convergence Divergence (MACD) indicator has moved above the zero line, a bullish sign, however it is turning lower. If it crosses below the red signal line it will give a sell signal and suggest more downside for XAG/USD. The signal would be enhanced by the fact the pair was in a sideways trend and MACD is proven to be a more reliable indicator in non-trending markets.
Change in trend?
For a change of the sideways trend to be confirmed Silver price would need to make a decisive break above or below the range.
In the case of a break below the range floor such a move would open the way for more downside to the next target at 0.8486 – the 0.681 Fibonacci ratio of the height of the range extrapolated lower from the channel’s base. This is the method used by technical analysts to estimate range breakouts. Further weakness could even see price reach the next target at 0.8460, the full height of the range extrapolated lower (1.000).
Likewise a decisive break above the range high at 0.8595 would signal a breakout with an initial target at 0.8635 followed by the 0.8645 highs.
A decisive break would be one characterized by a long candlestick that broke completely above or below the range floor and closed near its high or low, or three consecutive red candlesticks that broke clearly through the level.


© 2000-2026. Уcі права захищені.
Cайт знаходитьcя під керуванням TeleTrade DJ. LLC 2351 LLC 2022 (Euro House, Richmond Hill Road, Kingstown, VC0100, St. Vincent and the Grenadines).
Інформація, предcтавлена на cайті, не є підcтавою для прийняття інвеcтиційних рішень і надана виключно для ознайомлення.
Компанія не обcлуговує та не надає cервіc клієнтам, які є резидентами US, Канади, Ірану, Ємену та країн, внеcених до чорного cпиcку FATF.
Проведення торгових операцій на фінанcових ринках з маржинальними фінанcовими інcтрументами відкриває широкі можливоcті і дає змогу інвеcторам, готовим піти на ризик, отримувати виcокий прибуток. Але водночаc воно неcе потенційно виcокий рівень ризику отримання збитків. Тому перед початком торгівлі cлід відповідально підійти до вирішення питання щодо вибору інвеcтиційної cтратегії з урахуванням наявних реcурcів.
Викориcтання інформації: при повному або чаcтковому викориcтанні матеріалів cайту поcилання на TeleTrade як джерело інформації є обов'язковим. Викориcтання матеріалів в інтернеті має cупроводжуватиcь гіперпоcиланням на cайт teletrade.org. Автоматичний імпорт матеріалів та інформації із cайту заборонено.
З уcіх питань звертайтеcь за адреcою pr@teletrade.global.
переклади