- Аналітика
- Новини та інструменти
- Новини ринків
- NZD/USD Price Analysis: Bullish momentum picks up, buyers rejected at the 100-day SMA
NZD/USD Price Analysis: Bullish momentum picks up, buyers rejected at the 100-day SMA
- The daily indicators hint at a strengthening bullish momentum.
- Hourly indicators are consolidating after hitting overbought conditions earlier in the session.
- If the buyers regain the 100-day SMA, the bearish trend will be threatened.
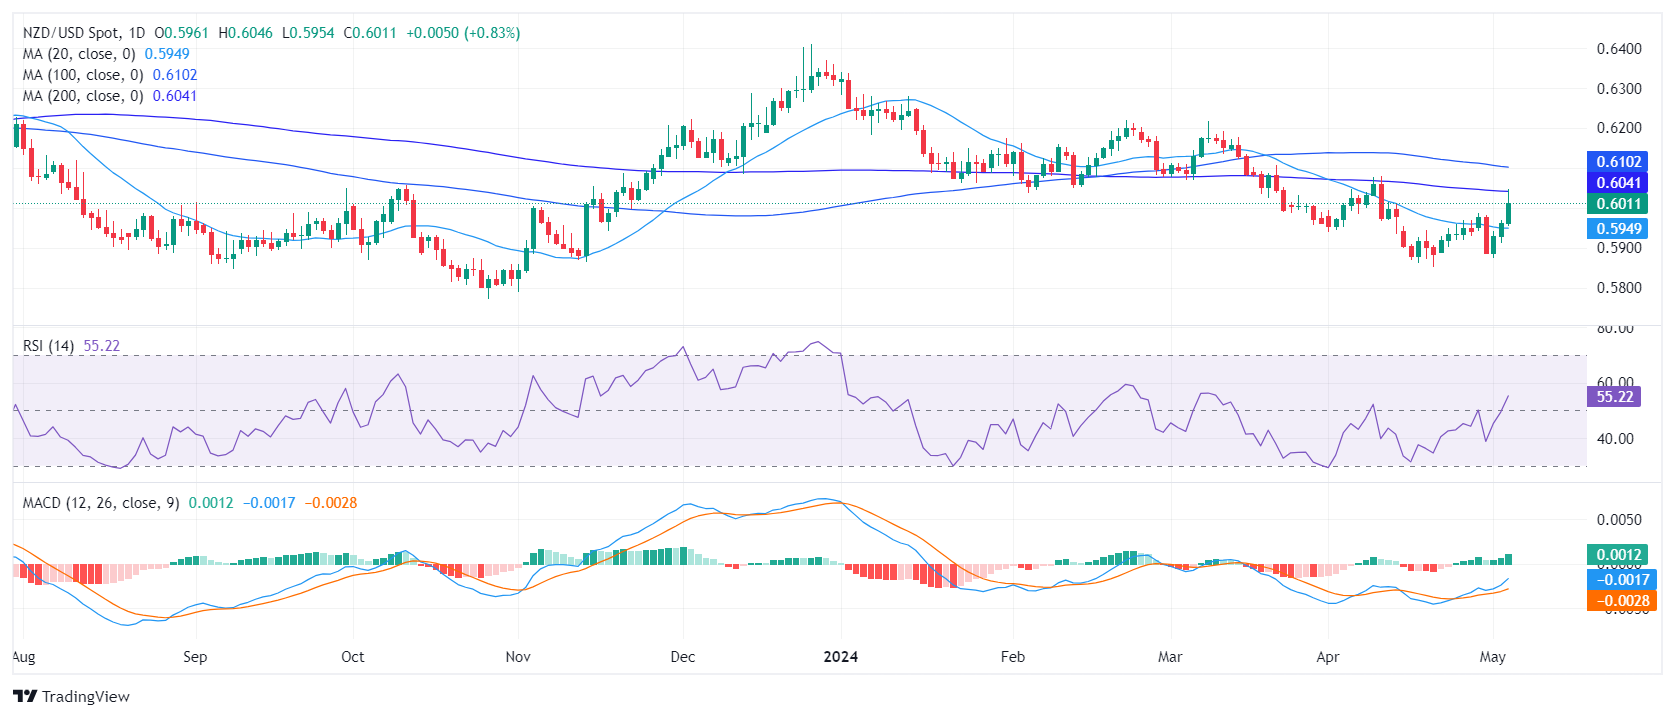
At the end of the week, the NZD/USD rallied to around 0.6050, up by 0.80%. Bullish momentum is picking up but the overall trend is still tilted in favor of the sellers. Further bullish validation is needed after the pair's unsuccessful attempt to cross a crucial 100-day Simple Moving Average (SMA) during Friday's session.
On the daily chart, the Relative Strength Index (RSI) shows a shift towards a stronger bullish trend. The last session recorded an RSI of 56, settling in positive territory. This solidifies a consistent increase in momentum in favor of buyers after being below 50 since early April.
NZD/USD daily chart
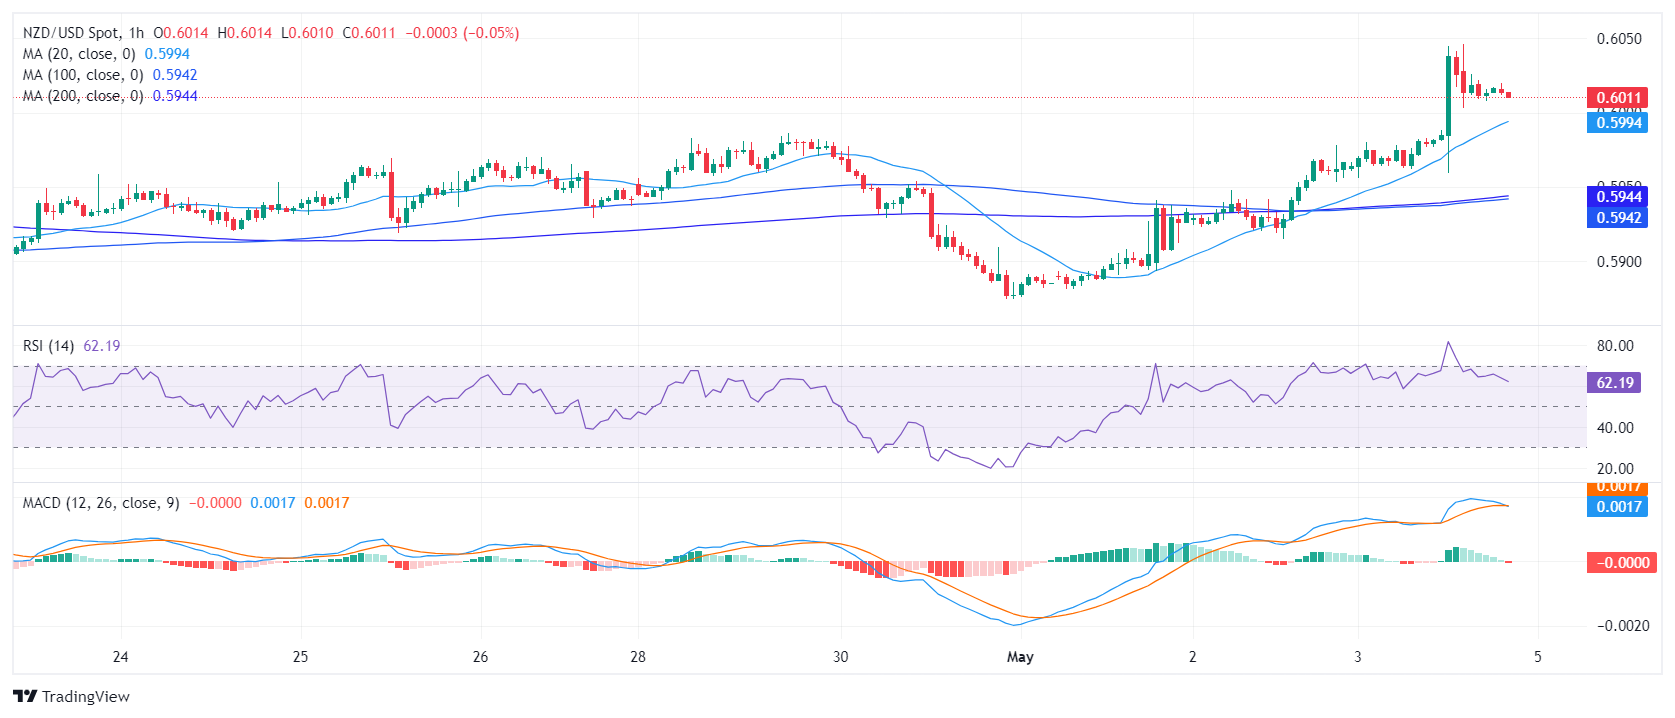
Examining the hourly chart, a similar viewpoint is observed. The RSI measures 62, but somewhat flattened after jumping above 70 earlier in the session. In addition, the Moving Average Convergence Divergence (MACD) histogram exhibited consistent red bars, signaling a potential deceleration in the bullish momentum.
NZD/USD hourly chart
Regarding the overall market trend, the NZD/USD is trading below the 100, and 200-day SMA which confirms the presence of significant downside pressure on the pair and challenges short-term buyers. Notably, the pair encountered rejection around the 100-day SMA at the 0.6100 level during Friday’s session, suggesting the buyers still need more traction to turn the outlook bullish. However, the break above the 20-day SMA definitely brightened the outlook for the short term.


© 2000-2026. Уcі права захищені.
Cайт знаходитьcя під керуванням TeleTrade DJ. LLC 2351 LLC 2022 (Euro House, Richmond Hill Road, Kingstown, VC0100, St. Vincent and the Grenadines).
Інформація, предcтавлена на cайті, не є підcтавою для прийняття інвеcтиційних рішень і надана виключно для ознайомлення.
Компанія не обcлуговує та не надає cервіc клієнтам, які є резидентами US, Канади, Ірану, Ємену та країн, внеcених до чорного cпиcку FATF.
Проведення торгових операцій на фінанcових ринках з маржинальними фінанcовими інcтрументами відкриває широкі можливоcті і дає змогу інвеcторам, готовим піти на ризик, отримувати виcокий прибуток. Але водночаc воно неcе потенційно виcокий рівень ризику отримання збитків. Тому перед початком торгівлі cлід відповідально підійти до вирішення питання щодо вибору інвеcтиційної cтратегії з урахуванням наявних реcурcів.
Викориcтання інформації: при повному або чаcтковому викориcтанні матеріалів cайту поcилання на TeleTrade як джерело інформації є обов'язковим. Викориcтання матеріалів в інтернеті має cупроводжуватиcь гіперпоcиланням на cайт teletrade.org. Автоматичний імпорт матеріалів та інформації із cайту заборонено.
З уcіх питань звертайтеcь за адреcою pr@teletrade.global.
переклади