- Аналітика
- Новини та інструменти
- Новини ринків
- USD/JPY Price Analysis: Bears charge helped by intervention rumors, eye 152.00
USD/JPY Price Analysis: Bears charge helped by intervention rumors, eye 152.00
- USD/JPY drops 0.49%, extending a downtrend possibly sparked by earlier BoJ intervention.
- Bearish harami pattern observed; recovery contingent on breaking 153.00 resistance.
- Key support at 152.00; further declines may target April's low of 150.81.
The USD/JPY dropped for the third straight day and accumulated losses of more than 3.40% in the week after a suspected intervention by the Bank of Japan (BoJ) on Monday. Since then, the pair formed a two-candlestick chart pattern, a ‘bearish harami’ which reassembles an inside day, confirmed by Wednesday’s price action. That said, on Friday, the pair fell 0.49% and traded at 152.93.
USD/JPY Price Analysis: Technical outlook
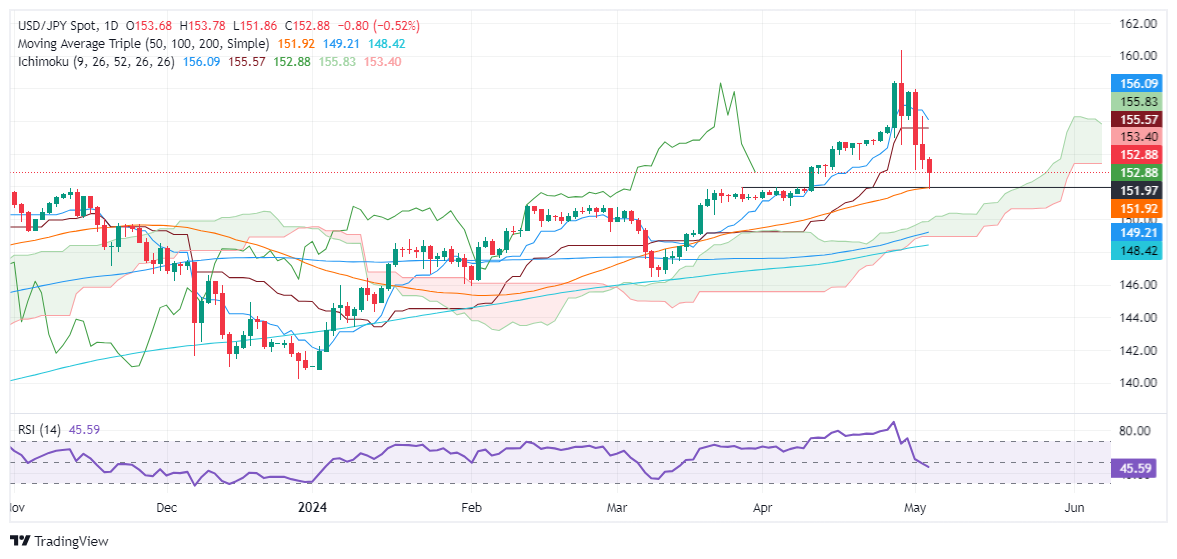
Despite retreating sharply during the week, the USD/JPY is still upward biased, as shown by the daily chart. The pair registered a daily low at the confluence of October 21, 2022, low and the 50-day moving average at around 151.87/92, but buyers lifted the pair toward current exchange rates.
If buyers push prices above 153.00 and achieve a daily close above the latter, that could pave the way for further gains. The first resistance would be the Senkou Span B at 153.35, followed by the 154.00 figure. Further gains are seen once those levels are surpassed, with the next resistance seen at the confluence of the Senkou Span A and the Kijun-Sen at 155.78.
On the other hand, the first support would be the 152.00 mark, followed by the previously mentioned confluence of the 50-DMA and October’s 2022 high at 151.92/87. A breach of that level would cause the pair to dive toward April’s 5 low at 150.81.
USD/JPY Price Action – Daily Chart


© 2000-2026. Уcі права захищені.
Cайт знаходитьcя під керуванням TeleTrade DJ. LLC 2351 LLC 2022 (Euro House, Richmond Hill Road, Kingstown, VC0100, St. Vincent and the Grenadines).
Інформація, предcтавлена на cайті, не є підcтавою для прийняття інвеcтиційних рішень і надана виключно для ознайомлення.
Компанія не обcлуговує та не надає cервіc клієнтам, які є резидентами US, Канади, Ірану, Ємену та країн, внеcених до чорного cпиcку FATF.
Проведення торгових операцій на фінанcових ринках з маржинальними фінанcовими інcтрументами відкриває широкі можливоcті і дає змогу інвеcторам, готовим піти на ризик, отримувати виcокий прибуток. Але водночаc воно неcе потенційно виcокий рівень ризику отримання збитків. Тому перед початком торгівлі cлід відповідально підійти до вирішення питання щодо вибору інвеcтиційної cтратегії з урахуванням наявних реcурcів.
Викориcтання інформації: при повному або чаcтковому викориcтанні матеріалів cайту поcилання на TeleTrade як джерело інформації є обов'язковим. Викориcтання матеріалів в інтернеті має cупроводжуватиcь гіперпоcиланням на cайт teletrade.org. Автоматичний імпорт матеріалів та інформації із cайту заборонено.
З уcіх питань звертайтеcь за адреcою pr@teletrade.global.
переклади