- Аналітика
- Новини та інструменти
- Новини ринків
- NZD/JPY Price Analysis: Buyers dominance diminishes, market could favor sellers soon
NZD/JPY Price Analysis: Buyers dominance diminishes, market could favor sellers soon
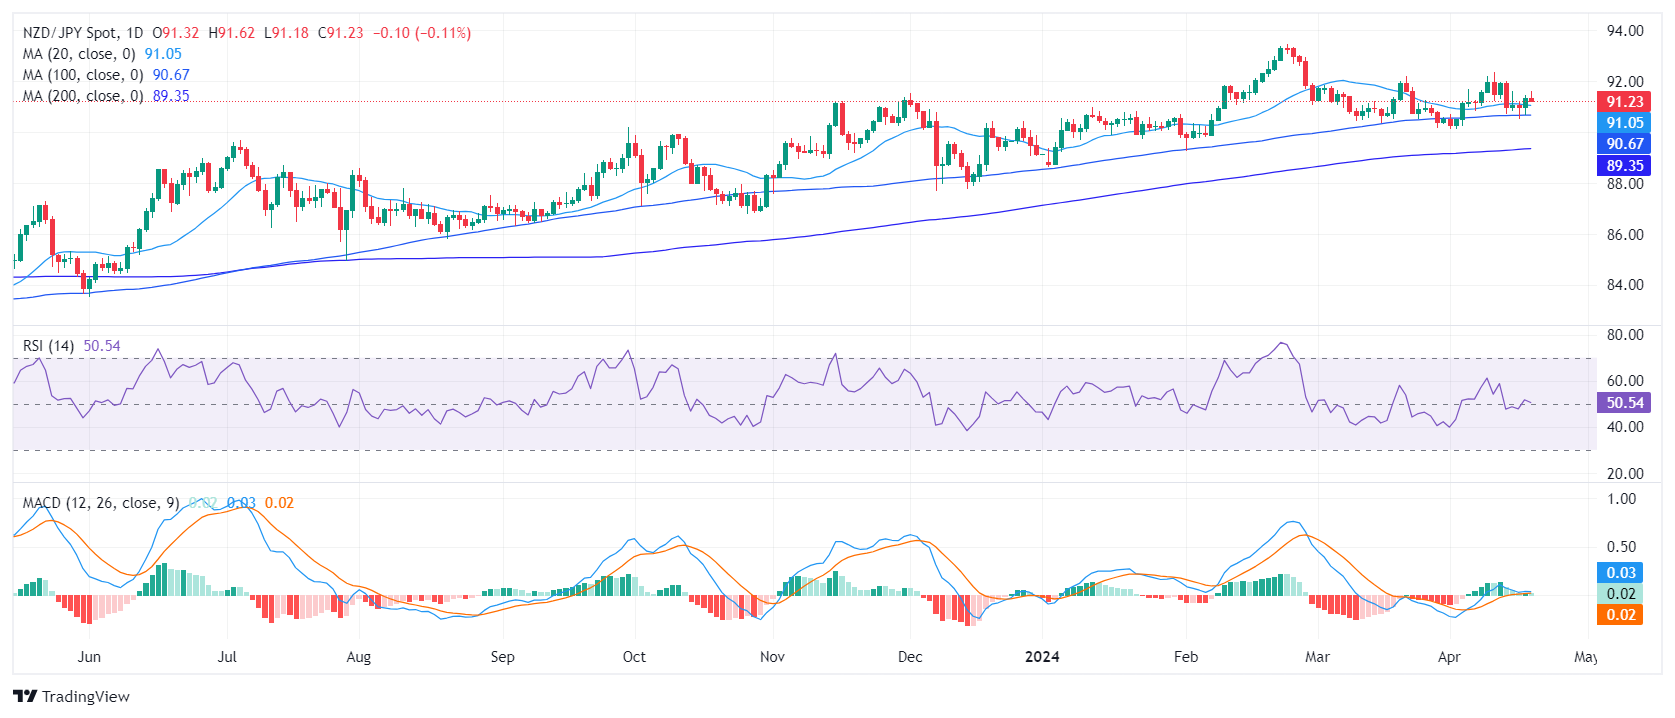
- The daily RSI shows that buyers' hold over the market is likely fading, signaling the growing presence of sellers.
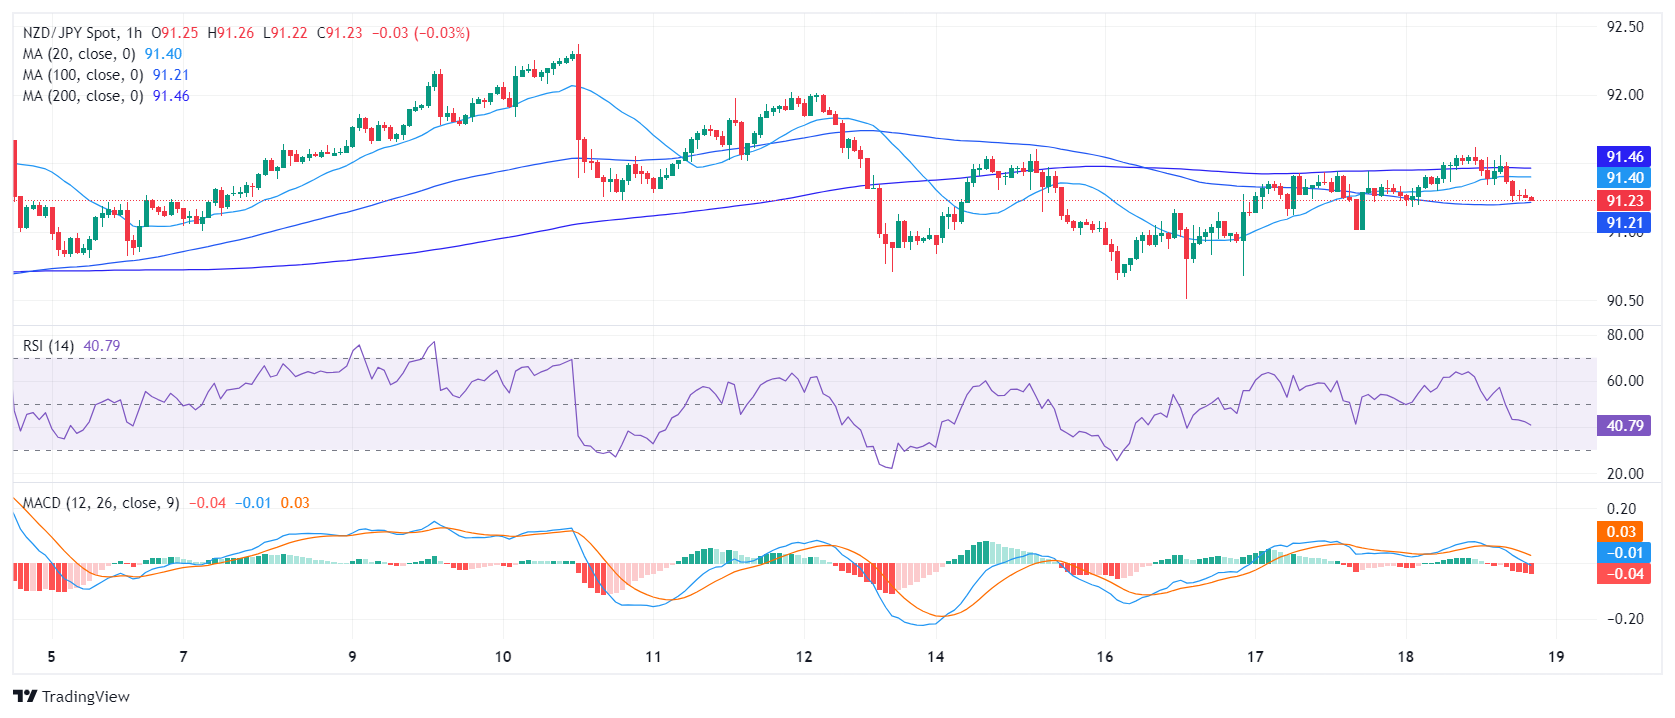
- On the hourly chart, indicators underline a prominent seller command in the past sessions.
The NZD/JPY is trading slightly lower at around 91.23. It seems the firm grip buyers had over the market is dwindling, yet the pair doggedly persists above crucial Simple Moving Averages (SMAs). Market watchers should eye the short-term trajectory of the NZD/JPY for any potential shifts that could give sellers the upper hand. Specifically, if bears breach the 20-day Simple Moving Average (SMA) at 91.00.
On the daily RSI fluctuates around the positive region but is currently pointing down. This, combined with the rising red bars trend in the MACD (Moving Average Converge Divergence) histogram, indicates that buyer dominance is fading and the market could begin favoring sellers soon.
NZD/JPY daily chart
In addition, the hourly Relative Strength Index (RSI) hovers below the neutral 50 line, reflecting a dominant presence of sellers in the recent sessions. The negative thrust is confirmed by the MACD, which reveals decreasing green bars, indicating diminishing positive momentum.
NZD/JPY hourly chart
Upon evaluating the broader landscape, the NZD/JPY is currently hovering above its key Simple Moving Averages (SMAs), reflecting continued buying pressure thereby sustaining the long-term uptrend. However, the pair closely challenges the 20-day SMA, suggesting potential for further downward movements if this level doesn’t hold. Moreover, the pair maintaining a stance above the 100 and 200-day SMAs reinforces a long-term bullish view.


© 2000-2026. Уcі права захищені.
Cайт знаходитьcя під керуванням TeleTrade DJ. LLC 2351 LLC 2022 (Euro House, Richmond Hill Road, Kingstown, VC0100, St. Vincent and the Grenadines).
Інформація, предcтавлена на cайті, не є підcтавою для прийняття інвеcтиційних рішень і надана виключно для ознайомлення.
Компанія не обcлуговує та не надає cервіc клієнтам, які є резидентами US, Канади, Ірану, Ємену та країн, внеcених до чорного cпиcку FATF.
Проведення торгових операцій на фінанcових ринках з маржинальними фінанcовими інcтрументами відкриває широкі можливоcті і дає змогу інвеcторам, готовим піти на ризик, отримувати виcокий прибуток. Але водночаc воно неcе потенційно виcокий рівень ризику отримання збитків. Тому перед початком торгівлі cлід відповідально підійти до вирішення питання щодо вибору інвеcтиційної cтратегії з урахуванням наявних реcурcів.
Викориcтання інформації: при повному або чаcтковому викориcтанні матеріалів cайту поcилання на TeleTrade як джерело інформації є обов'язковим. Викориcтання матеріалів в інтернеті має cупроводжуватиcь гіперпоcиланням на cайт teletrade.org. Автоматичний імпорт матеріалів та інформації із cайту заборонено.
З уcіх питань звертайтеcь за адреcою pr@teletrade.global.
переклади