- Аналітика
- Новини та інструменти
- Новини ринків
- NZD/JPY Price Analysis: Negative momentum gains traction, broader outlook still positive
NZD/JPY Price Analysis: Negative momentum gains traction, broader outlook still positive
- The daily chart RSI signals NZD/JPY's shift towards negative momentum.
- Hourly RSI reveals an oscillating pattern in oversold territory, indicating increasing bearish pressure.
The NZD/JPY declined to 90.95 on Friday, marking a decrease of 1%. Sellers have gained significant ground and hourly indicators indicate oversold conditions which suggests that the pair might sideways trade in the next sessions. As for now, the short term has turned somewhat bearish for the cross as it lost the 20-day Simple Moving Average (SMA).
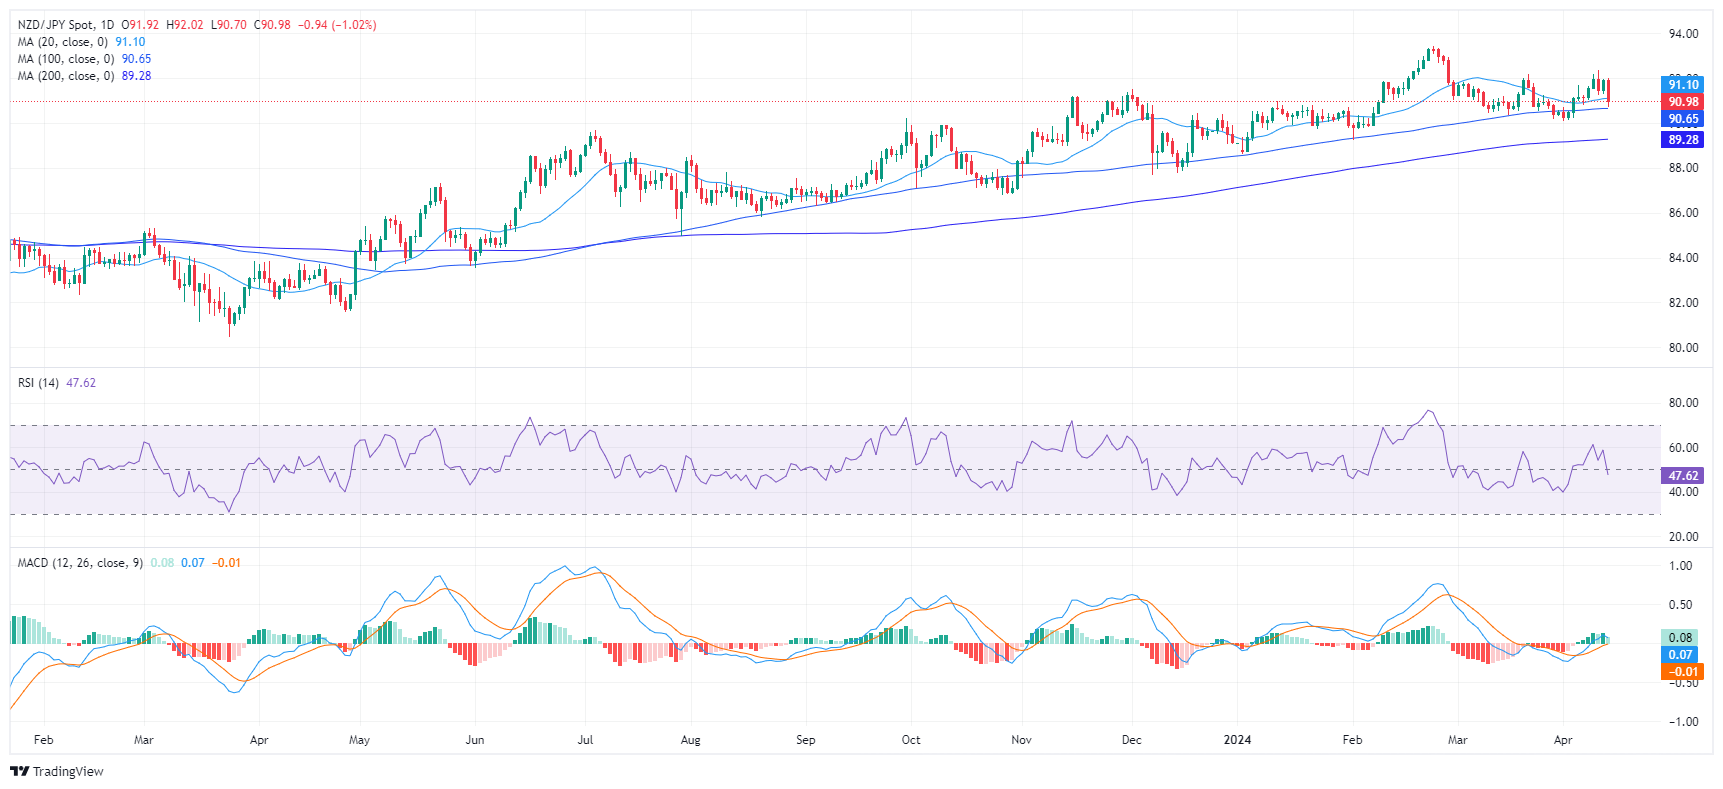
Based on the indicators of the daily chart, the NZD/JPY has pivoted towards a negative momentum. Its Relative Strength Index (RSI) is settling into negative territory, with a last reading of 47. This change indicates that sellers are taking control after a period of positive strength that had the RSI peaking at 63 this week.
NZD/JPY daily chart
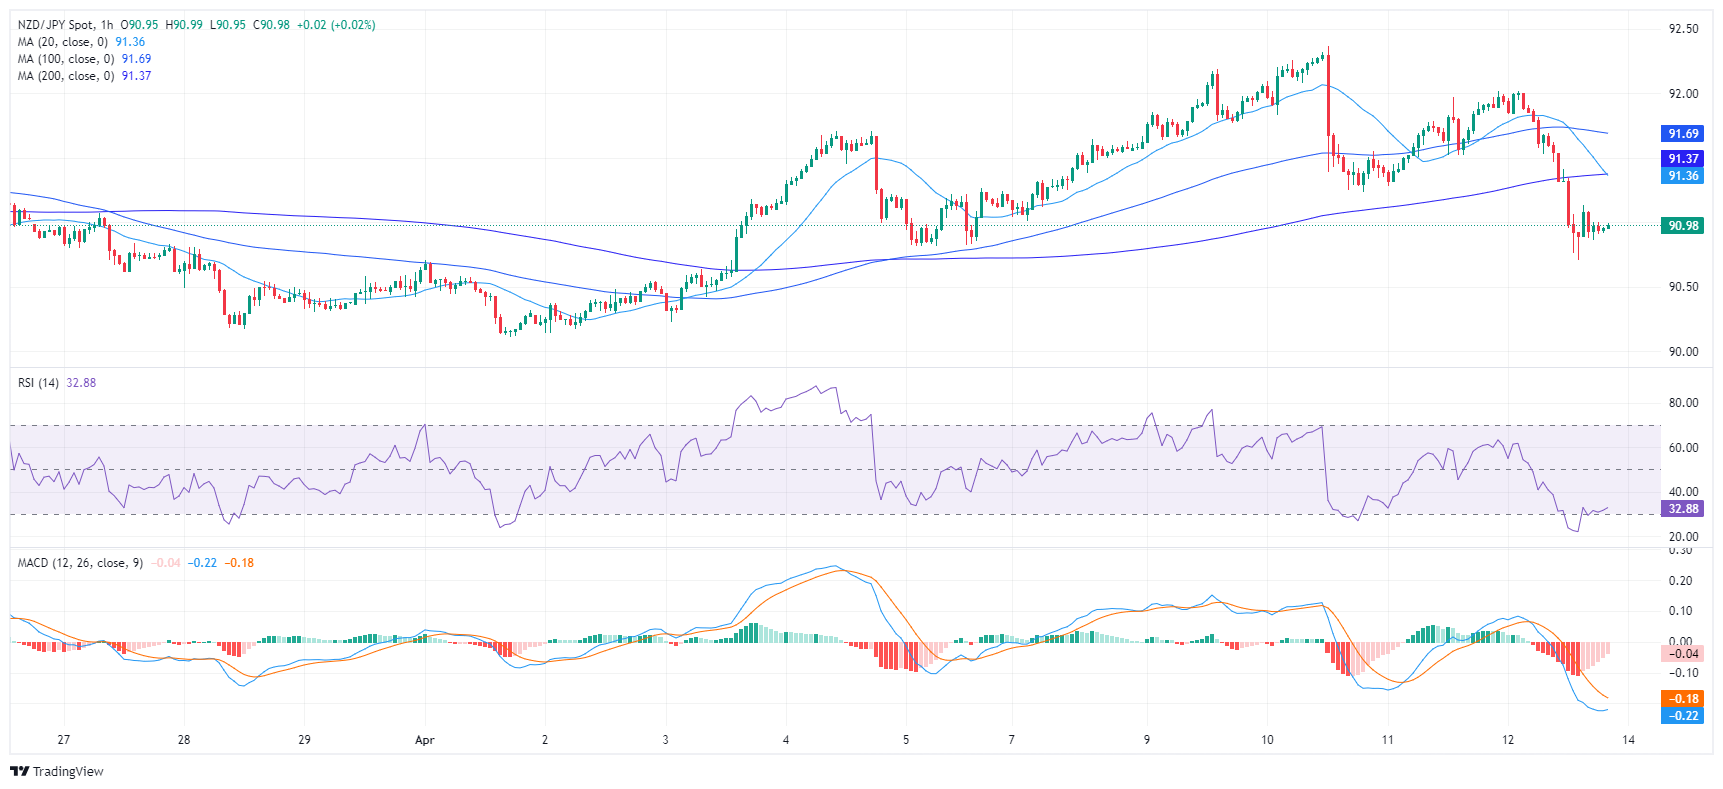
From the hourly chart, the RSI values reveal oversold conditions, with the most recent reading dipping to 30. The Moving Average Convergence Divergence (MACD) histogram generates flat red bars, signaling sustained negative momentum. This coincides with a drop in buyer demand over the past hours, and it could set the tone for the upcoming trading sessions. However, a consolidation shouldn't be ruled out as bears might take a breather.
NZD/JPY hourly chart
In the broader outlook, the NZD/JPY, based on its Simple Moving Average (SMA) still holds a positive outlook as it holds above the 100 and 200-day SMAs. However, the cross, having fallen today below the 20-day SMA, presents a bearish signal for the short term which aligns with the indicators on the daily and hourly chart.


© 2000-2026. Уcі права захищені.
Cайт знаходитьcя під керуванням TeleTrade DJ. LLC 2351 LLC 2022 (Euro House, Richmond Hill Road, Kingstown, VC0100, St. Vincent and the Grenadines).
Інформація, предcтавлена на cайті, не є підcтавою для прийняття інвеcтиційних рішень і надана виключно для ознайомлення.
Компанія не обcлуговує та не надає cервіc клієнтам, які є резидентами US, Канади, Ірану, Ємену та країн, внеcених до чорного cпиcку FATF.
Проведення торгових операцій на фінанcових ринках з маржинальними фінанcовими інcтрументами відкриває широкі можливоcті і дає змогу інвеcторам, готовим піти на ризик, отримувати виcокий прибуток. Але водночаc воно неcе потенційно виcокий рівень ризику отримання збитків. Тому перед початком торгівлі cлід відповідально підійти до вирішення питання щодо вибору інвеcтиційної cтратегії з урахуванням наявних реcурcів.
Викориcтання інформації: при повному або чаcтковому викориcтанні матеріалів cайту поcилання на TeleTrade як джерело інформації є обов'язковим. Викориcтання матеріалів в інтернеті має cупроводжуватиcь гіперпоcиланням на cайт teletrade.org. Автоматичний імпорт матеріалів та інформації із cайту заборонено.
З уcіх питань звертайтеcь за адреcою pr@teletrade.global.
переклади