- Аналітика
- Новини та інструменти
- Новини ринків
- EUR/USD under pressure after US CPI and FOMC minutes
EUR/USD under pressure after US CPI and FOMC minutes
- US headline and core CPI exceeded expectations, rising to 3.5% and 3.8% respectively in March.
- FOMC minutes from March highlighted uncertainty about the persistence of high inflation and the efficacy of monetary policy.
The EUR/USD pair declined to 1.0739, representing a substantial decline of 1.1%. This decline has occurred following the release of hot inflation figures from the US which fueled hawkish bets on the Federal Reserve (Fed). The Federal Open Market Committee (FOMC) minutes from the March meeting didn’t trigger any reaction.
The US Bureau of Labor Statistics (BLS) revealed on Wednesday that the nation's inflation rate, reflected by the Consumer Price Index (CPI), increased from 3.2% in February to 3.5% in March on an annual basis. This outstripped the predicted market forecast of 3.4%. The yearly core CPI, which omits fluctuating food and energy costs, mirrored February's growth by rising 3.8%. Both the CPI and the core CPI climbed by 0.4% monthly, exceeding analysts' projection of 0.3%. As a reaction, US Treasury yields soared while the odds of a June Rate cut by the Fed declined to over 20%. The mix of hawkish bets as rising yields benefited the USD during the session.
On the other hand, the FOMC Minutes disclosed a general lack of assurance amongst participants concerning the persistence of high inflation rates, with recent data failing to bolster their trust in the economy cooling down and t in the inflation rate steadily reaching the 2% benchmark. With inflation running hot as well as the labor market, officials may change their language and slowly give up on the chances of a June rate cut by the Fed.
EUR/USD technical analysis
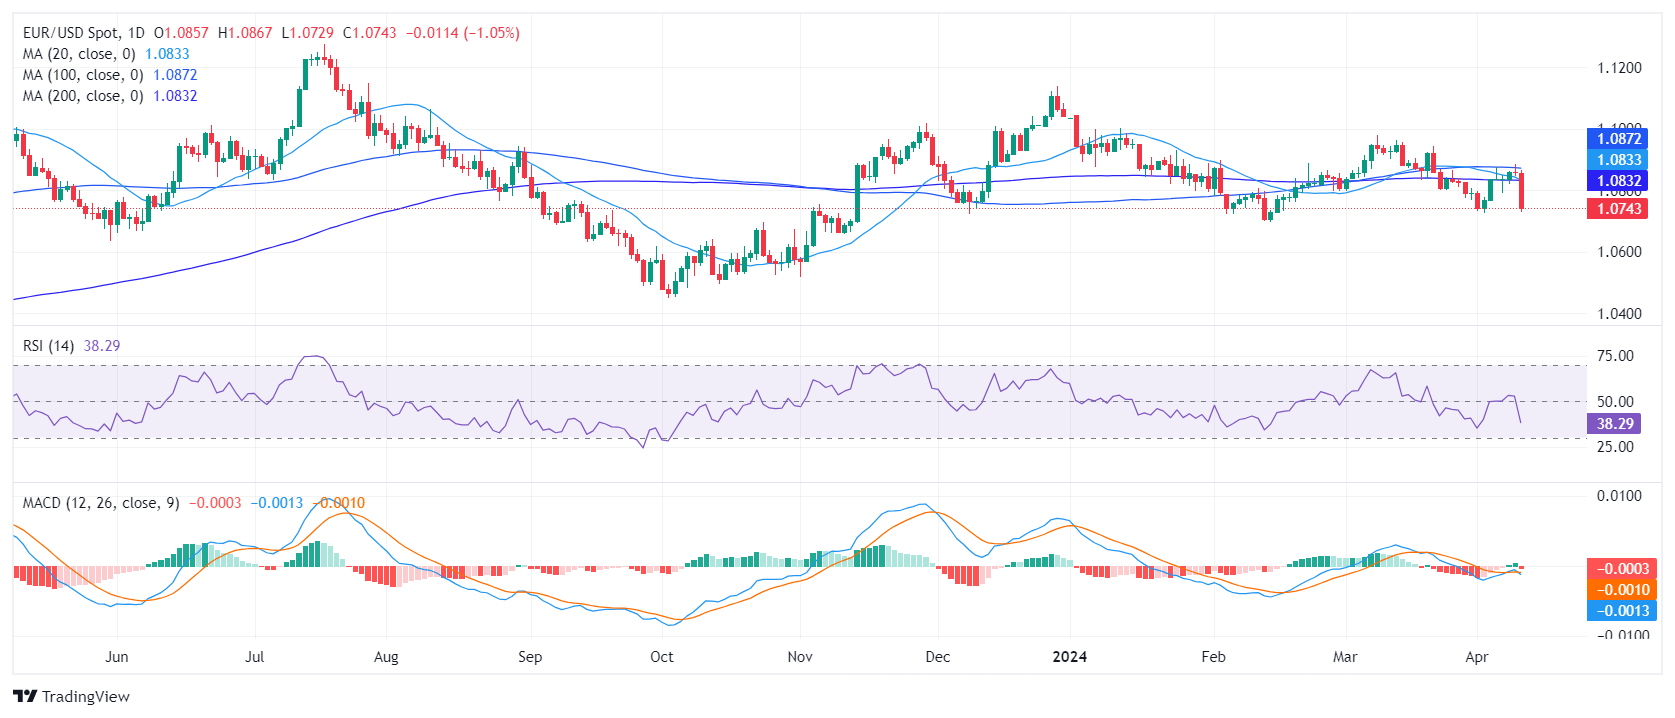
On the daily chart, the Relative Strength Index (RSI) fell within negative territory, with the latest reading at 38. This deviation from a positive trend suggests a shift in market dominance towards the sellers. Along with the RSI, the Moving Average Convergence Divergence (MACD) displayed a fresh red bar, indicating negative market momentum.
In the broader outlook, the EUR/USD also exhibits a bearish trend as it is positioned below key Simple Moving Averages (SMAs). SMAs are tools used to smooth out significant price data fluctuations over specific time periods to discern market trends. Specifically, today it fell below the 200-day SMA, typically considered a long-term trend indicator.

© 2000-2026. Уcі права захищені.
Cайт знаходитьcя під керуванням TeleTrade DJ. LLC 2351 LLC 2022 (Euro House, Richmond Hill Road, Kingstown, VC0100, St. Vincent and the Grenadines).
Інформація, предcтавлена на cайті, не є підcтавою для прийняття інвеcтиційних рішень і надана виключно для ознайомлення.
Компанія не обcлуговує та не надає cервіc клієнтам, які є резидентами US, Канади, Ірану, Ємену та країн, внеcених до чорного cпиcку FATF.
Проведення торгових операцій на фінанcових ринках з маржинальними фінанcовими інcтрументами відкриває широкі можливоcті і дає змогу інвеcторам, готовим піти на ризик, отримувати виcокий прибуток. Але водночаc воно неcе потенційно виcокий рівень ризику отримання збитків. Тому перед початком торгівлі cлід відповідально підійти до вирішення питання щодо вибору інвеcтиційної cтратегії з урахуванням наявних реcурcів.
Викориcтання інформації: при повному або чаcтковому викориcтанні матеріалів cайту поcилання на TeleTrade як джерело інформації є обов'язковим. Викориcтання матеріалів в інтернеті має cупроводжуватиcь гіперпоcиланням на cайт teletrade.org. Автоматичний імпорт матеріалів та інформації із cайту заборонено.
З уcіх питань звертайтеcь за адреcою pr@teletrade.global.


