- Аналітика
- Новини та інструменти
- Новини ринків
- EUR/USD Price Analysis: Moves above 1.0850; next barrier at previous week’s high
EUR/USD Price Analysis: Moves above 1.0850; next barrier at previous week’s high
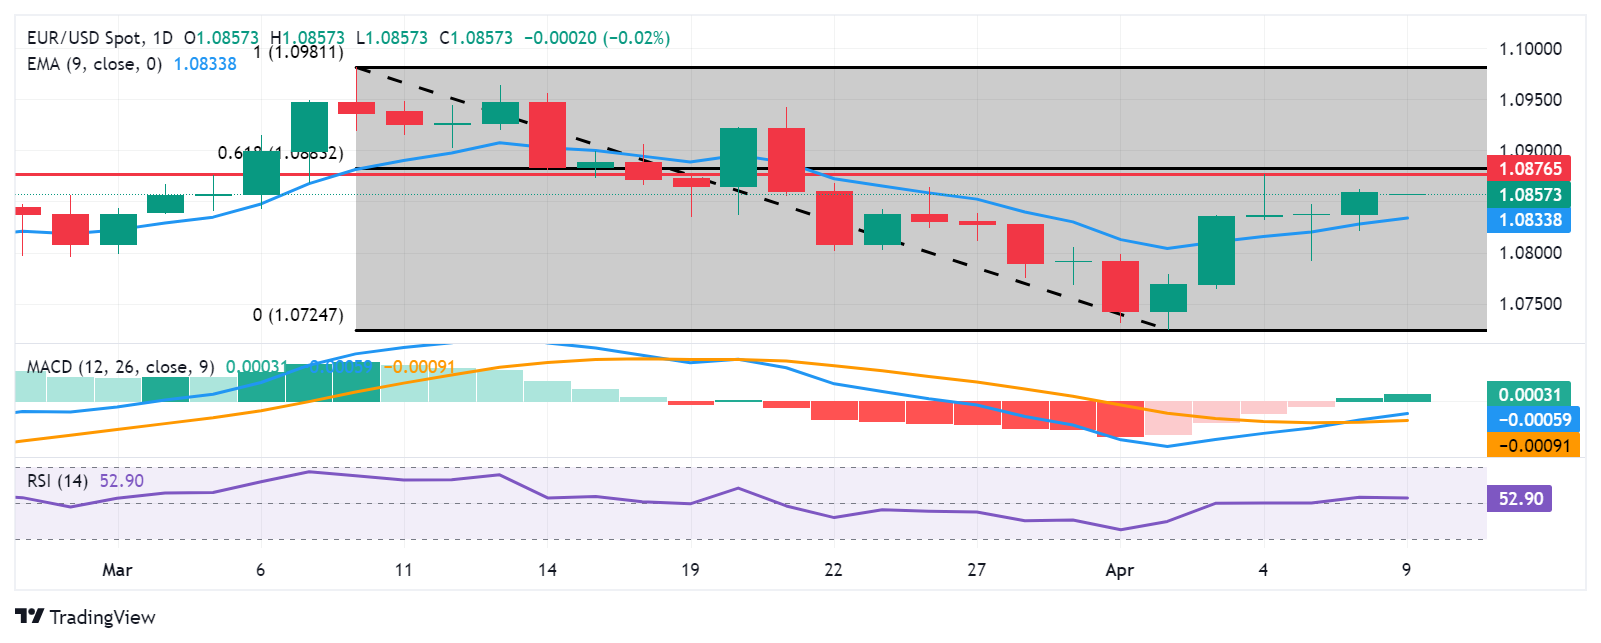
- EUR/USD could retest the previous week’s high of 1.0876.
- The resistance zone appears around the 61.8% Fibo level of 1.0883 and the psychological level of 1.0900.
- The major level of 1.0850 could act as a key support, followed by the nine-day EMA at 1.0833.
EUR/USD put efforts to continue its winning streak for the sixth successive session on Tuesday. The pair hovers around 1.0860 during the Asian session. In the daily-frame chart, the pair shows that it is taking support on the nine-day Exponential Moving Average (EMA), which suggests that the pair could move upward to retest the strong resistance at the previous week’s high at 1.0876.
Furthermore, the EUR/USD pair could explore the 61.8% Fibonacci retracement level of 1.0883, followed by the psychological level of 1.0900.
Additionally, technical analysis suggests a bullish sentiment for the EUR/USD pair. The 14-day Relative Strength Index (RSI) is positioned above the 50 mark, indicating strength in buying momentum.
The lagging indicator, Moving Average Convergence Divergence (MACD), shows a divergence above the signal line, which indicates gaining strength for the pair. However, it is still positioned below the centreline. So, the traders are likely to await MACD to offer a clear trend direction.
On the downside, the EUR/USD pair could find immediate support at the major level of 1.0850, followed by the nine-day EMA at 1.0833. A break below this level could lead the pair to navigate the region around the psychological level of 1.0800 following the previous week’s low at 1.0724.
EUR/USD: Daily Chart


© 2000-2026. Уcі права захищені.
Cайт знаходитьcя під керуванням TeleTrade DJ. LLC 2351 LLC 2022 (Euro House, Richmond Hill Road, Kingstown, VC0100, St. Vincent and the Grenadines).
Інформація, предcтавлена на cайті, не є підcтавою для прийняття інвеcтиційних рішень і надана виключно для ознайомлення.
Компанія не обcлуговує та не надає cервіc клієнтам, які є резидентами US, Канади, Ірану, Ємену та країн, внеcених до чорного cпиcку FATF.
Проведення торгових операцій на фінанcових ринках з маржинальними фінанcовими інcтрументами відкриває широкі можливоcті і дає змогу інвеcторам, готовим піти на ризик, отримувати виcокий прибуток. Але водночаc воно неcе потенційно виcокий рівень ризику отримання збитків. Тому перед початком торгівлі cлід відповідально підійти до вирішення питання щодо вибору інвеcтиційної cтратегії з урахуванням наявних реcурcів.
Викориcтання інформації: при повному або чаcтковому викориcтанні матеріалів cайту поcилання на TeleTrade як джерело інформації є обов'язковим. Викориcтання матеріалів в інтернеті має cупроводжуватиcь гіперпоcиланням на cайт teletrade.org. Автоматичний імпорт матеріалів та інформації із cайту заборонено.
З уcіх питань звертайтеcь за адреcою pr@teletrade.global.
переклади