- Аналітика
- Новини та інструменти
- Новини ринків
- GBP/USD Price Analysis: Pound Sterling looks vulnerable whilst below 1.2665
GBP/USD Price Analysis: Pound Sterling looks vulnerable whilst below 1.2665
- The Pound Sterling holds its rebound from seven-month lows against the US Dollar.
- GBP/USD stays cautious ahead of Wednesday’s US CPI inflation data.
- The Pound Sterling faces downside risks, as the daily RSI remains below 50.00.
The Pound Sterling (GBP) Is trading on the back foot against the US Dollar (USD), as the GBP/USD pair manages to hold above the 1.2600 level at the start of the week on Monday.
A negative shift in risk sentiment, despite easing Middle East geopolitical tensions, weighs on the higher-yielding Pound Sterling while the US Dollar struggles for traction amid the market’s nervousness ahead of Wednesday’s US Consumer Price Index (CPI) data.
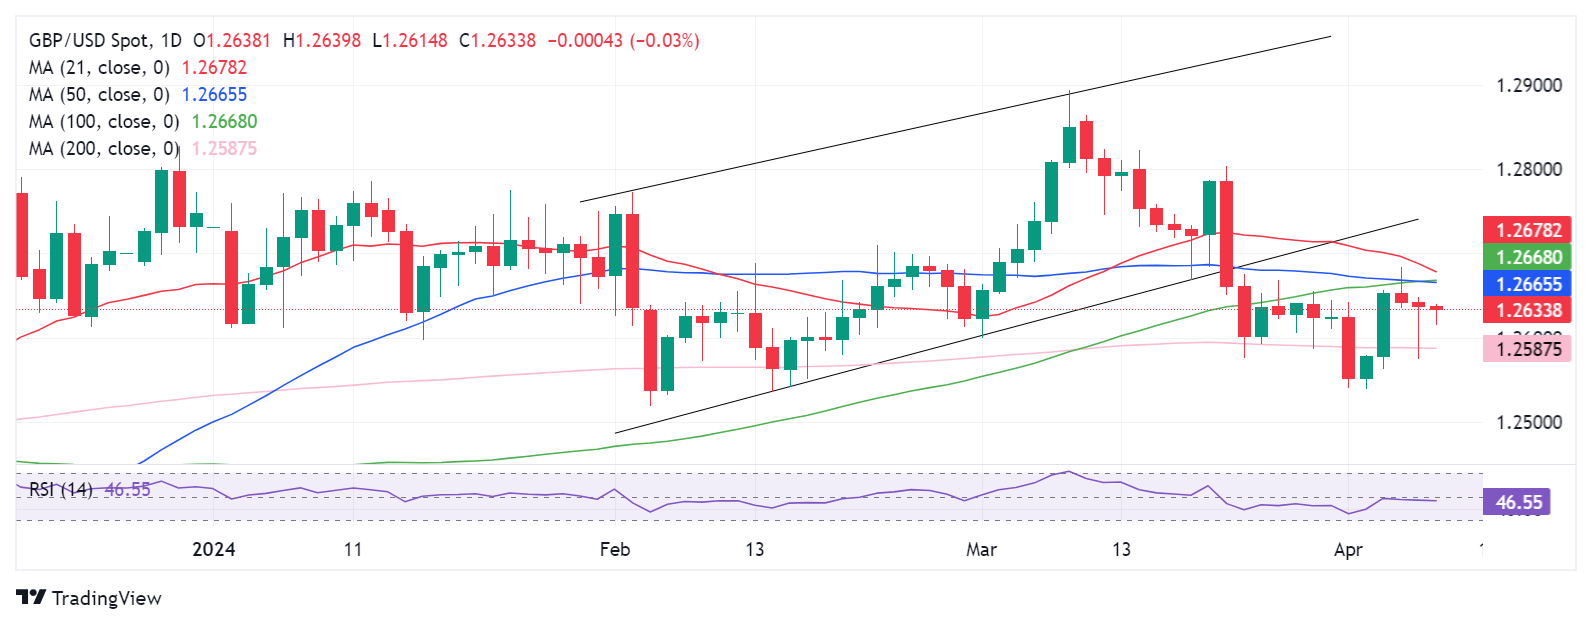
From a short-term technical perspective, GBP/USD remains vulnerable and looks set to extend the downside break from the rising channel seen a couple of weeks ago.
The 14-day Relative Strength Index (RSI) indicator points lower below the midline, currently near 46.50, suggesting that risks remain skewed in favor of sellers.
Pound Sterling sellers, however, need to seek a daily candlestick closing below the horizontal 200-day Simple Moving Average (SMA) at 1.2587 to initiate a sustained downtrend.
The April low near 1.2540 could come to buyers' rescue then, followed by the 1.2500 round figure. Further south, the 1.2450 static support will challenge the bullish commitments.
If buyers defend the 200-day SMA at 1.2587, it could alleviate the near-term selling pressure, allowing GBP/USD to attempt a comeback toward the static resistance shy of the 1.2700 level.
GBP/USD must scale the critical confluence resistance at 1.2665 to add extra legs to the rebound toward 1.2700. The 1.2665 level is the intersection of the 100-day and 50-day SMAs.
GBP/USD: Daily chart
© 2000-2026. Уcі права захищені.
Cайт знаходитьcя під керуванням TeleTrade DJ. LLC 2351 LLC 2022 (Euro House, Richmond Hill Road, Kingstown, VC0100, St. Vincent and the Grenadines).
Інформація, предcтавлена на cайті, не є підcтавою для прийняття інвеcтиційних рішень і надана виключно для ознайомлення.
Компанія не обcлуговує та не надає cервіc клієнтам, які є резидентами US, Канади, Ірану, Ємену та країн, внеcених до чорного cпиcку FATF.
Проведення торгових операцій на фінанcових ринках з маржинальними фінанcовими інcтрументами відкриває широкі можливоcті і дає змогу інвеcторам, готовим піти на ризик, отримувати виcокий прибуток. Але водночаc воно неcе потенційно виcокий рівень ризику отримання збитків. Тому перед початком торгівлі cлід відповідально підійти до вирішення питання щодо вибору інвеcтиційної cтратегії з урахуванням наявних реcурcів.
Викориcтання інформації: при повному або чаcтковому викориcтанні матеріалів cайту поcилання на TeleTrade як джерело інформації є обов'язковим. Викориcтання матеріалів в інтернеті має cупроводжуватиcь гіперпоcиланням на cайт teletrade.org. Автоматичний імпорт матеріалів та інформації із cайту заборонено.
З уcіх питань звертайтеcь за адреcою pr@teletrade.global.


