- Аналітика
- Новини та інструменти
- Новини ринків
- NZD/JPY Price Analysis: Bearish reversal cues emerge, buyers give up gains
NZD/JPY Price Analysis: Bearish reversal cues emerge, buyers give up gains
- The daily chart signifies a bullish market; yet, the hourly chart shows hints of a short-term bearish reversal.
- The NZD significantly weakened during the American session and cleared daily gains.
- The hourly RSI dived from the overbought area near oversold terrain.
The NZD/JPY cleared all of its daily gains and fell by nearly 0.75% during the American session. Bearish clues emerge on the hourly chart, but the daily technical outlook remains somewhat bullish.
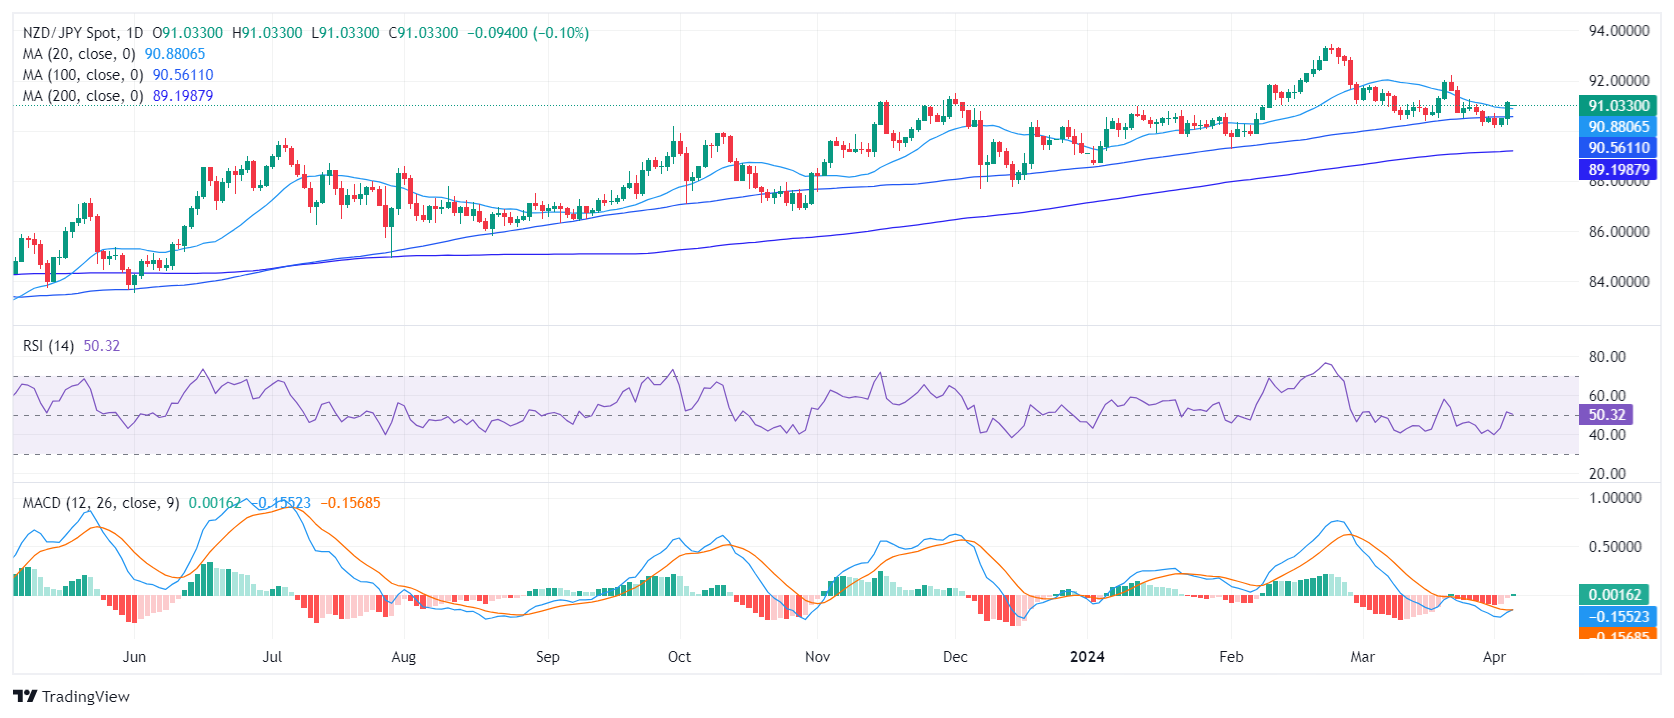
On the daily chart, the NZD/JPY Relative Strength Index (RSI) reveals its latest reading, slightly shifting towards a positive trend. The value is edging past the 50 mark after a period of predominantly being in negative terrain. However, with the latest RSI reading barely past 50, the momentum can still be seen as not strongly favoring the buyers.
NZD/JPY daily chart
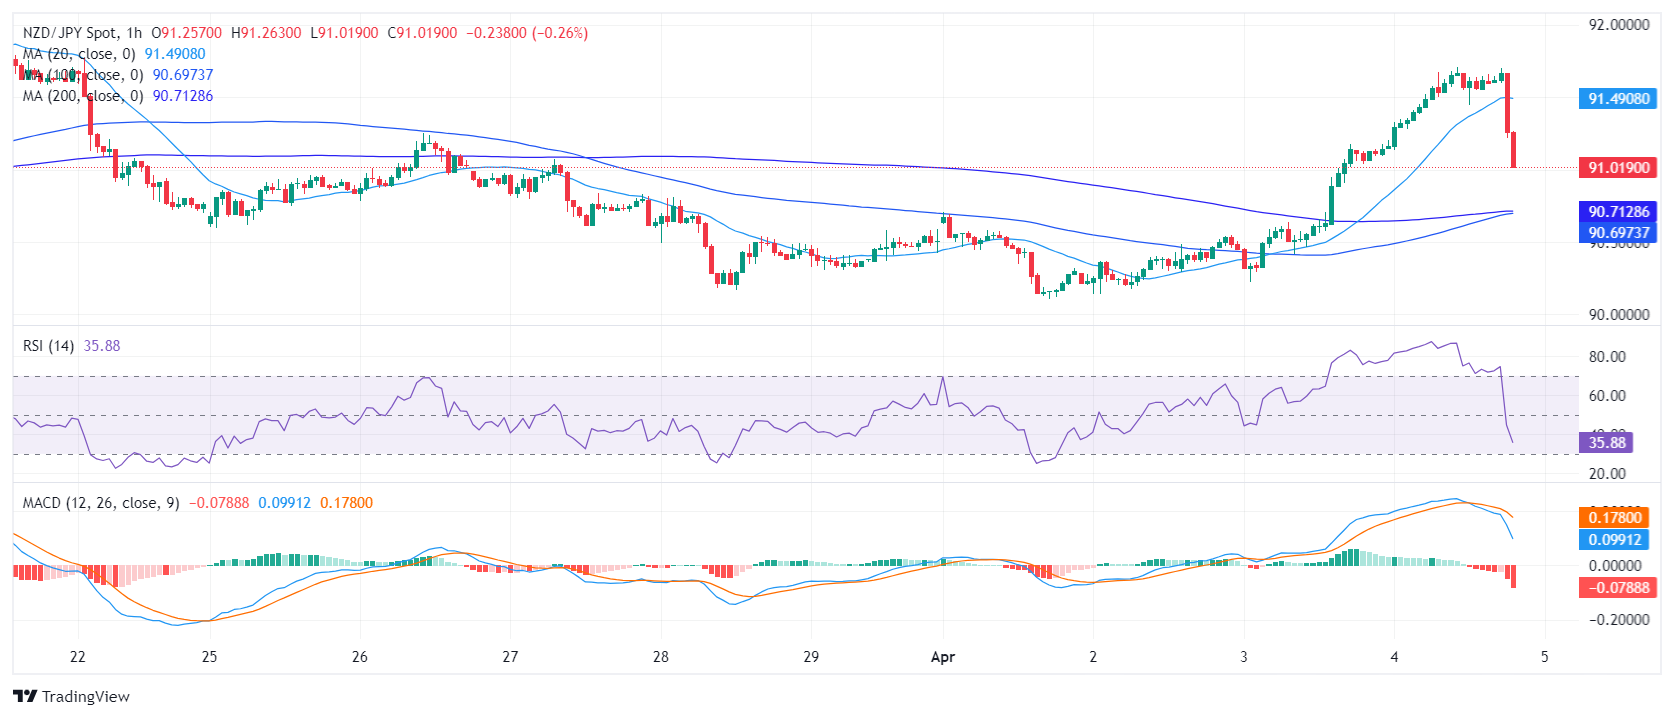
On the hourly RSI reading fell on the negative side after being near 70. The MACD histogram has begun to print rising red bars, also suggesting a rising negative momentum.
NZD/JPY hourly chart
Regarding the overall trend, the NZD/JPY pair jumped above the 20-day SMA today, often serving as a bullish short-term signal. In addition, the pair stands above its 100 and 200-day Simple Moving Average (SMA), also flashing a long-term positive outlook.
In conclusion, based on both the daily and hourly trends, plus taking the position in relation to the SMA into consideration, the NZD/JPY shows signs of a potential shift from a bearish to a bullish stance in the immediate term. However, if the bulls hold the above main SMAs, the outlook will still be positive.


© 2000-2026. Уcі права захищені.
Cайт знаходитьcя під керуванням TeleTrade DJ. LLC 2351 LLC 2022 (Euro House, Richmond Hill Road, Kingstown, VC0100, St. Vincent and the Grenadines).
Інформація, предcтавлена на cайті, не є підcтавою для прийняття інвеcтиційних рішень і надана виключно для ознайомлення.
Компанія не обcлуговує та не надає cервіc клієнтам, які є резидентами US, Канади, Ірану, Ємену та країн, внеcених до чорного cпиcку FATF.
Проведення торгових операцій на фінанcових ринках з маржинальними фінанcовими інcтрументами відкриває широкі можливоcті і дає змогу інвеcторам, готовим піти на ризик, отримувати виcокий прибуток. Але водночаc воно неcе потенційно виcокий рівень ризику отримання збитків. Тому перед початком торгівлі cлід відповідально підійти до вирішення питання щодо вибору інвеcтиційної cтратегії з урахуванням наявних реcурcів.
Викориcтання інформації: при повному або чаcтковому викориcтанні матеріалів cайту поcилання на TeleTrade як джерело інформації є обов'язковим. Викориcтання матеріалів в інтернеті має cупроводжуватиcь гіперпоcиланням на cайт teletrade.org. Автоматичний імпорт матеріалів та інформації із cайту заборонено.
З уcіх питань звертайтеcь за адреcою pr@teletrade.global.
переклади