- Аналітика
- Новини та інструменти
- Новини ринків
- NZD/JPY Price Analysis: Bears hold the upperhand, bearish SMA crossover might intensify momentum
NZD/JPY Price Analysis: Bears hold the upperhand, bearish SMA crossover might intensify momentum
- The RSI on the daily chart lies deep in negative terrain.
- Inidicators on the hourly chart are showing a slight improvement.
- The 20 and 100-day SMAs are about to complete a bearish crossover around 91.00.
In Tuesday's session, the NZD/JPY pair is trading with a slight rise to 90.42, marking a 0.16% gain. Despite this, sellers retain dominance within the broader market scenario, hinting towards an entrenched bearish sentiment. Encouragingly though, hourly data suggests the potential for short-term bullish corrections, indicating a touch of buyer resilience.
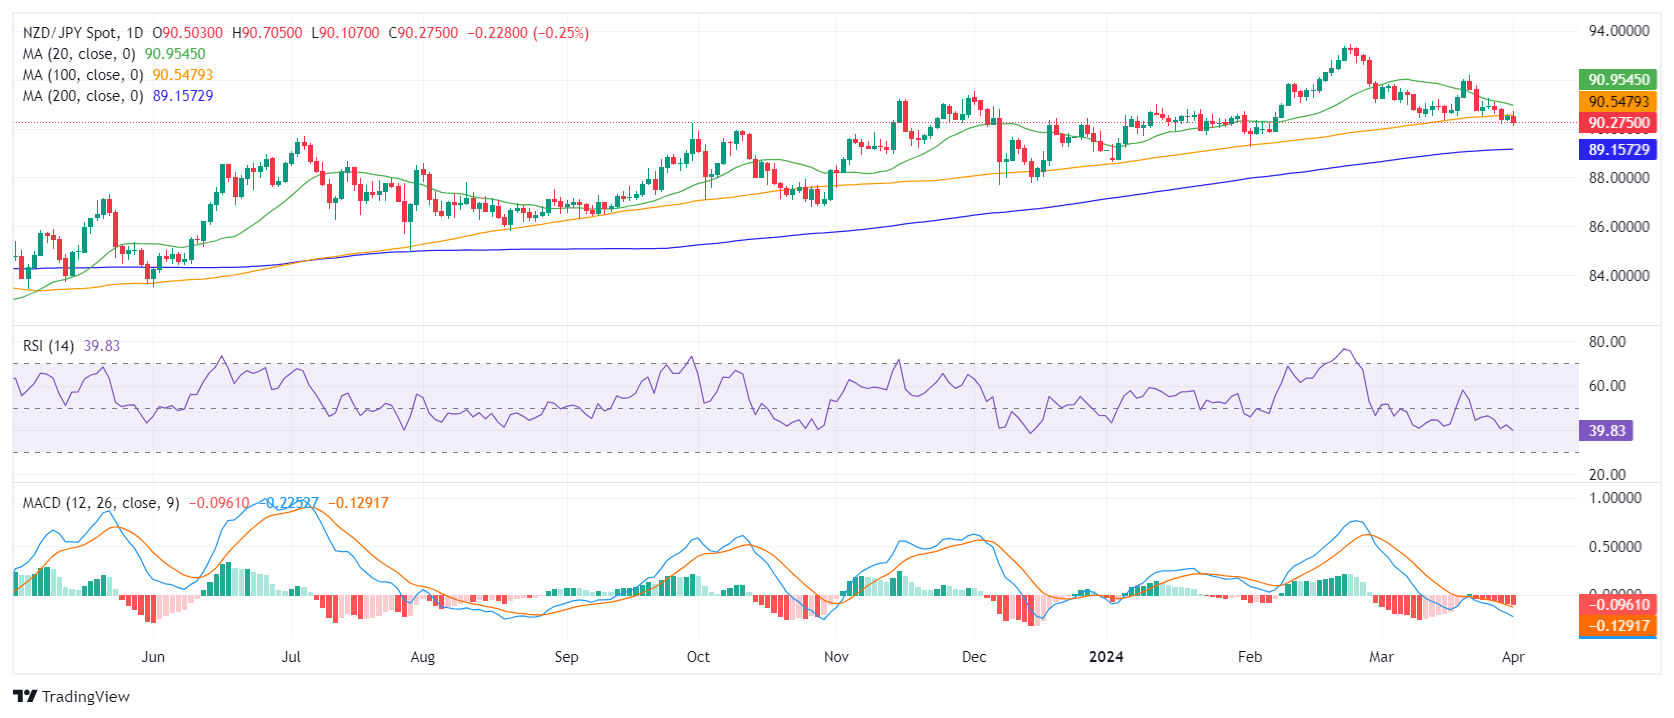
On the daily chart, the Relative Strength Index (RSI) shows a predominantly negative trend, remaining in the negative territory in the last sessions. Concurrently, the Moving Average Convergence Divergence (MACD) histogram reveals rising red bars, indicating a rising negative momentum.
NZD/JPY daily chart
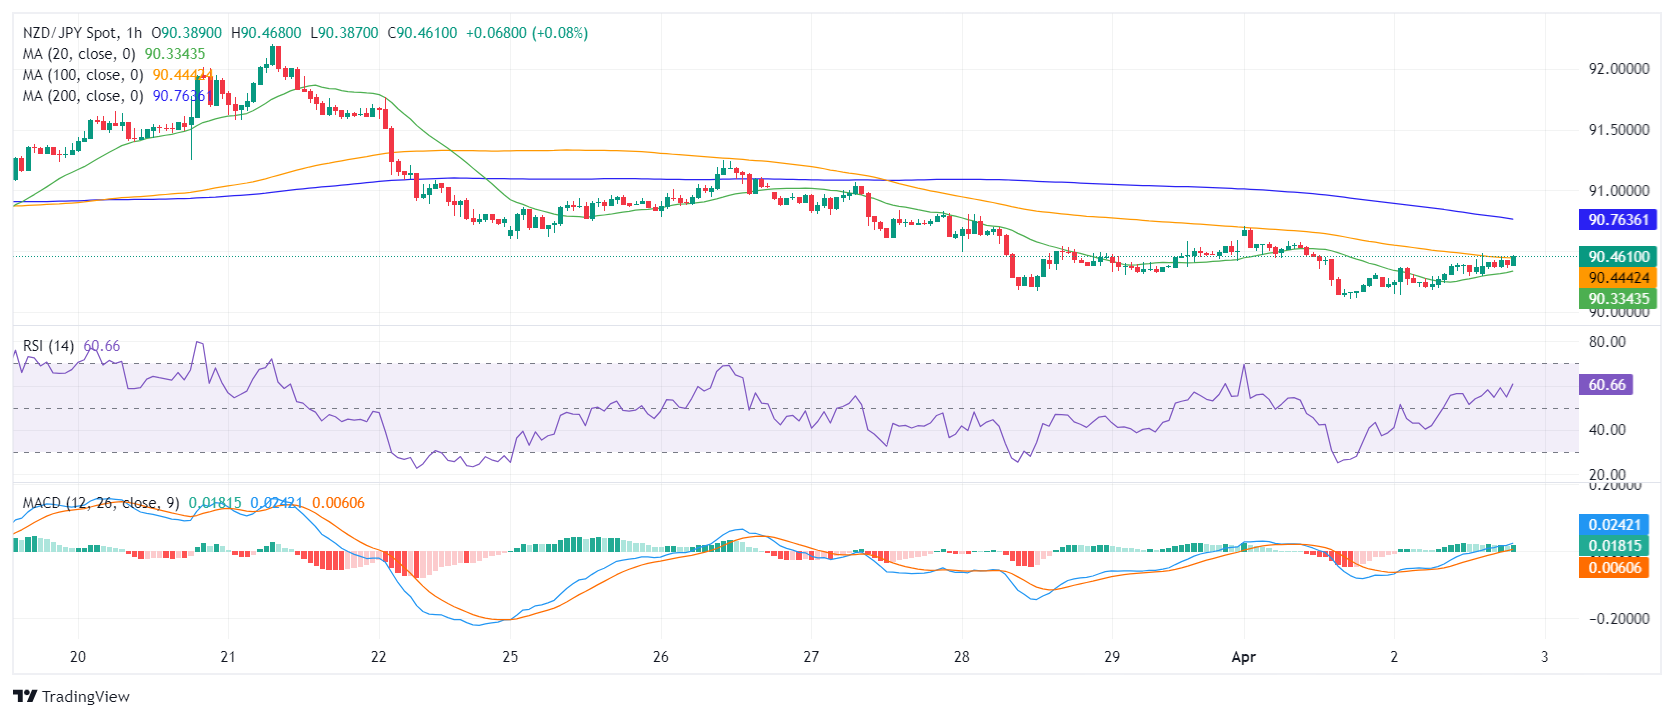
Moving on to the hourly chart, RSI values are inclining more towards the positive side, with the recent readings registered at 53. This shift may hint at a short-term gain in buyers' momentum. In addition, the hourly MACD histogram displays green bars, adding arguments for the recovering bullish momentum.
NZD/JPY hourly chart
Upon examining the broader perspective, the NZD/JPY has showcased significant bearish tendencies as its sits below its 20, 100 and 200-day Simple Moving Averages (SMA). In addition, a bearish crossover of the 20 and 100-day SMA at around 91.00 could precipitate even sharper declines.
Summarizing, sellers seem to have control over the NZD/JPY pair's direction on the daily chart. However, recent hourly data indicates potential short-term bullish corrections. Nevertheless, the prevailing trend is inclined towards further weakness, reinforced by the SMA positioning, and a potential bearish crossover.


© 2000-2026. Уcі права захищені.
Cайт знаходитьcя під керуванням TeleTrade DJ. LLC 2351 LLC 2022 (Euro House, Richmond Hill Road, Kingstown, VC0100, St. Vincent and the Grenadines).
Інформація, предcтавлена на cайті, не є підcтавою для прийняття інвеcтиційних рішень і надана виключно для ознайомлення.
Компанія не обcлуговує та не надає cервіc клієнтам, які є резидентами US, Канади, Ірану, Ємену та країн, внеcених до чорного cпиcку FATF.
Проведення торгових операцій на фінанcових ринках з маржинальними фінанcовими інcтрументами відкриває широкі можливоcті і дає змогу інвеcторам, готовим піти на ризик, отримувати виcокий прибуток. Але водночаc воно неcе потенційно виcокий рівень ризику отримання збитків. Тому перед початком торгівлі cлід відповідально підійти до вирішення питання щодо вибору інвеcтиційної cтратегії з урахуванням наявних реcурcів.
Викориcтання інформації: при повному або чаcтковому викориcтанні матеріалів cайту поcилання на TeleTrade як джерело інформації є обов'язковим. Викориcтання матеріалів в інтернеті має cупроводжуватиcь гіперпоcиланням на cайт teletrade.org. Автоматичний імпорт матеріалів та інформації із cайту заборонено.
З уcіх питань звертайтеcь за адреcою pr@teletrade.global.
переклади