- Аналітика
- Новини та інструменти
- Новини ринків
- EUR/JPY Price Analysis: Loses momentum under 163.00, further downside looks favorable
EUR/JPY Price Analysis: Loses momentum under 163.00, further downside looks favorable
- EUR/JPY edges lower to 162.75 amid the fear of FX intervention from the Bank of Japan (BoJ).
- The cross keeps the negative outlook below the key EMA; RSI indicator lies in bearish territory.
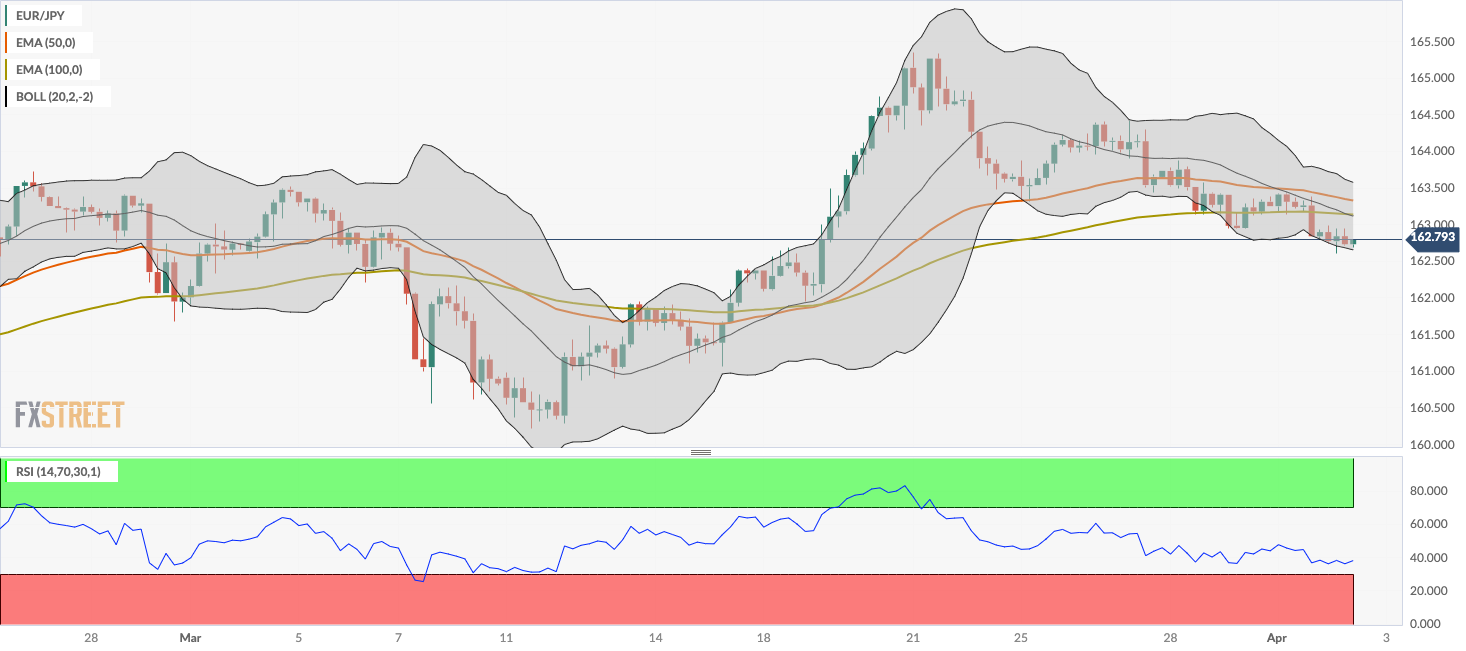
- The first upside barrier will emerge at 163.15; the first downside target is located at 162.65.
The EUR/JPY cross loses momentum near 162.75 during the early European trading hours on Tuesday. The growing speculation that the Bank of Japan (BoJ) will intervene in the foreign exchange market might support the Japanese Yen (JPY) in the near term. Early Tuesday, Japanese Finance Minister Shunichi Suzuki said that he will not rule out any steps to respond to disorderly moves and that he will monitor foreign exchange (FX) moves with a high sense of urgency.
From a technical perspective, the bearish outlook of EUR/JPY remains intact as the cross is below the 50- and 100-period Exponential Moving Averages (EMA) on the four-hour chart. The Relative Strength Index (RSI) lies in bearish territory around 36.40, supporting the sellers for the time being.
The first upside barrier for EUR/JPY will emerge near the 100-period EMA at 163.15. Further north, the next target is seen at the 50-period EMA at 163.32. A decisive break above the latter will expose the upper boundary of the Bollinger Band at 163.58. Any follow-through buying above this level would sustain its bullish move to a high of March 27 at 164.41.
On the flip side, the lower limit of the Bollinger Band at 162.65 acts as an initial support level for the cross. The key contention level is located at the 162.00 mark, representing a low of March 19 and a psychological level. A breach below 162.00 will see a drop to a low of March 14 at 161.10.
EUR/JPY four-hour chart


© 2000-2026. Уcі права захищені.
Cайт знаходитьcя під керуванням TeleTrade DJ. LLC 2351 LLC 2022 (Euro House, Richmond Hill Road, Kingstown, VC0100, St. Vincent and the Grenadines).
Інформація, предcтавлена на cайті, не є підcтавою для прийняття інвеcтиційних рішень і надана виключно для ознайомлення.
Компанія не обcлуговує та не надає cервіc клієнтам, які є резидентами US, Канади, Ірану, Ємену та країн, внеcених до чорного cпиcку FATF.
Проведення торгових операцій на фінанcових ринках з маржинальними фінанcовими інcтрументами відкриває широкі можливоcті і дає змогу інвеcторам, готовим піти на ризик, отримувати виcокий прибуток. Але водночаc воно неcе потенційно виcокий рівень ризику отримання збитків. Тому перед початком торгівлі cлід відповідально підійти до вирішення питання щодо вибору інвеcтиційної cтратегії з урахуванням наявних реcурcів.
Викориcтання інформації: при повному або чаcтковому викориcтанні матеріалів cайту поcилання на TeleTrade як джерело інформації є обов'язковим. Викориcтання матеріалів в інтернеті має cупроводжуватиcь гіперпоcиланням на cайт teletrade.org. Автоматичний імпорт матеріалів та інформації із cайту заборонено.
З уcіх питань звертайтеcь за адреcою pr@teletrade.global.
переклади