- Аналітика
- Новини та інструменти
- Новини ринків
- EUR/JPY Price Analysis: Bearish momentum gains steam, long-term bullish signals warrant vigilance
EUR/JPY Price Analysis: Bearish momentum gains steam, long-term bullish signals warrant vigilance
- Significant selling momentum is revealed in the daily chart as the RSI slips into negative zones while MACD signifies growing negative traction.
- In line with the daily chart, the hourly indicators show mounting selling pressure.
- The recent dip beneath the 20-day SMA may suggest a possible short-term bearish realignment.
The EUR/JPY pair is currently trading around 162.85, representing a decline of 0.30% during Monday's session. Bearish cues are intensifying as seen in the increase in selling momentum, which signals a possible shift from the preceding bullish trend.
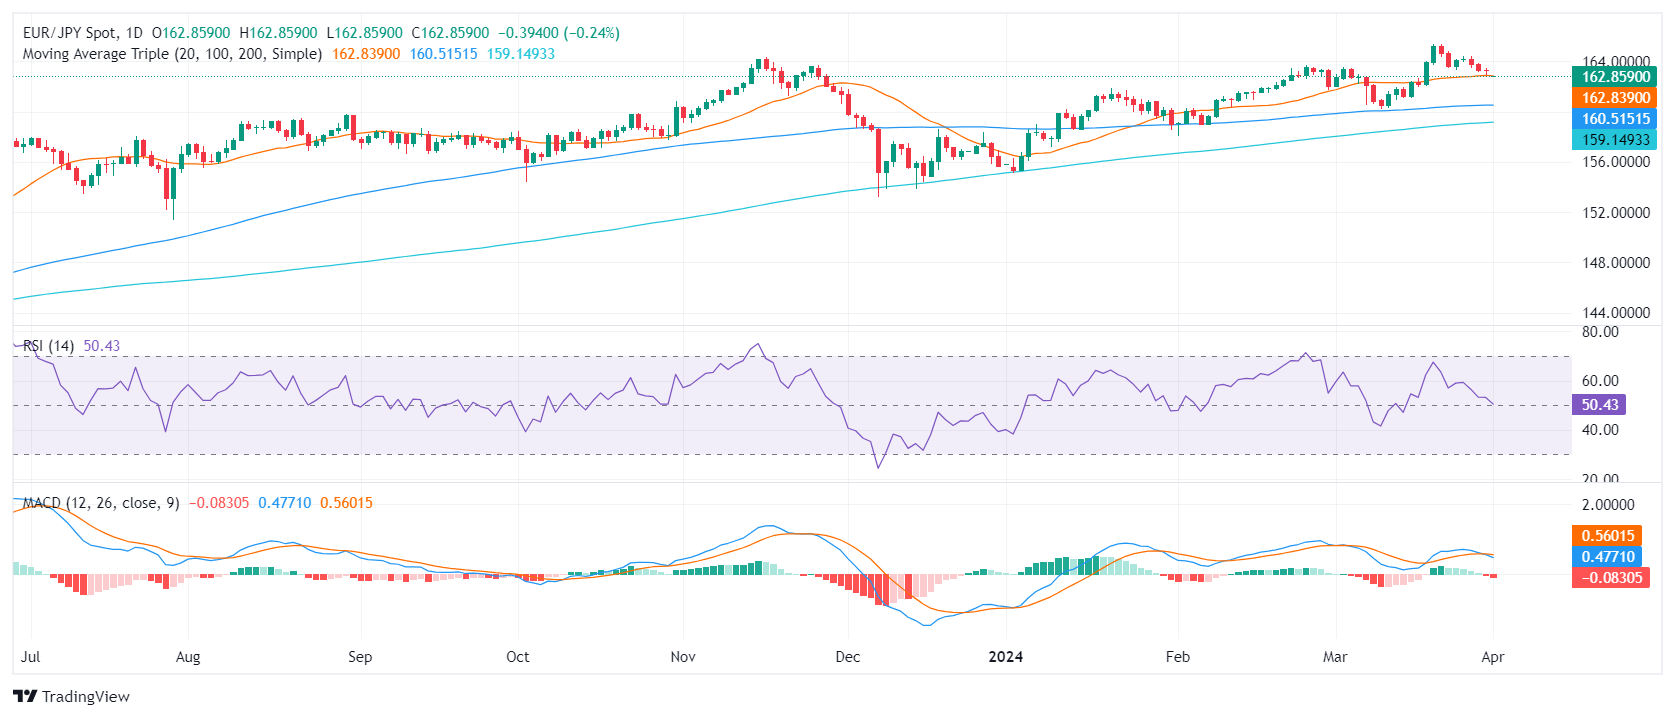
On the daily chart for EUR/JPY, the most recent Relative Strength Index (RSI) reading fell near negative territory. This situation tends to indicate a growing selling momentum. Concurrently, the Moving Average Convergence Divergence (MACD) histogram showcases rising red bars, implying a surge in negative momentum.
EUR/JPY daily chart
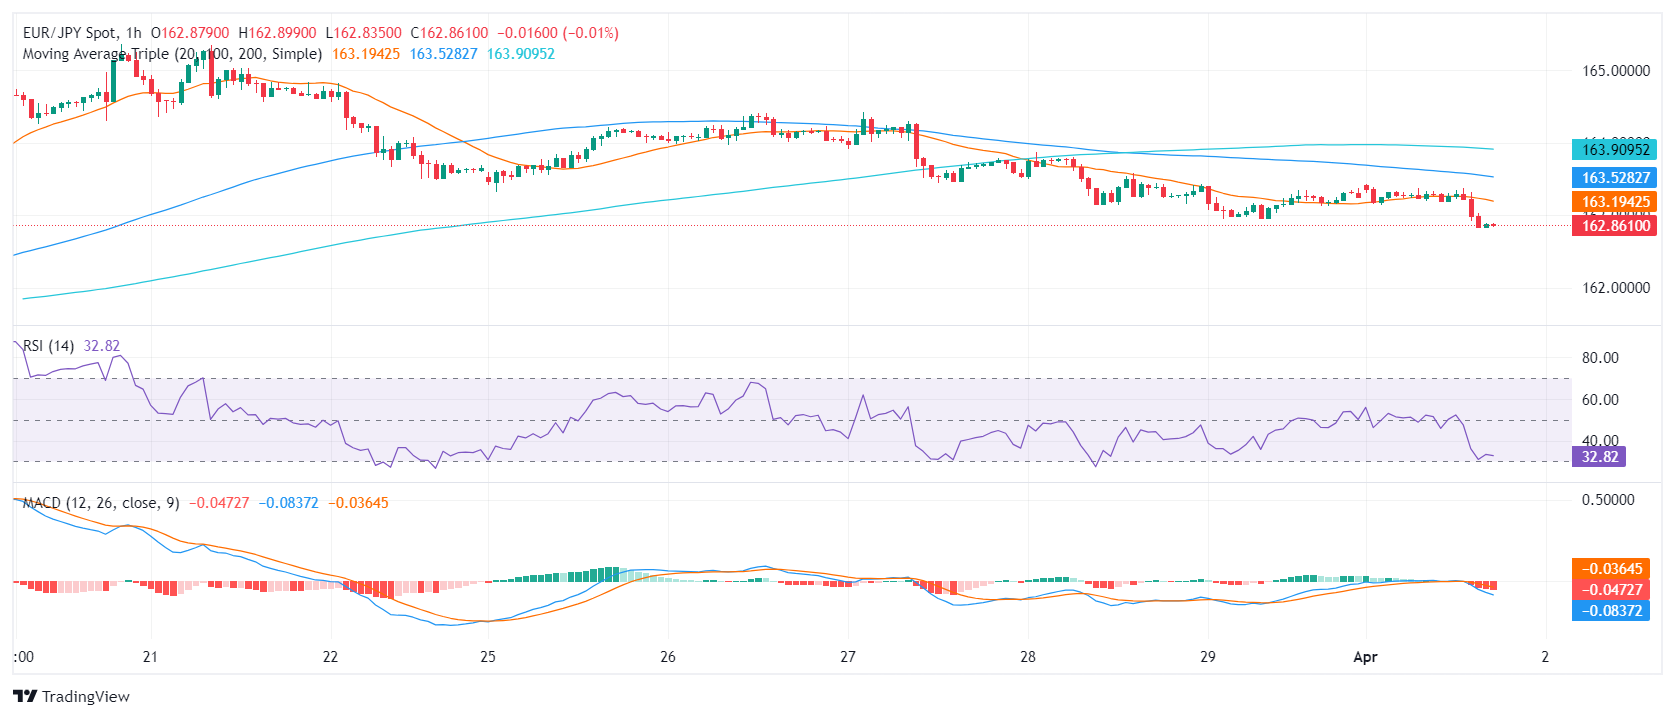
Assessing the hourly chart, the EUR/JPY pair showcases similar bearish sentiments. The RSI dipped near the oversold territory demonstrating the sellers' dominance in the market over the recent hours. Adding to this, the hourly MACD histogram reinforces this sentiment, illustrating rising red bars indicating a tilt towards negative momentum.
EUR/JPY hourly chart
Scrutinizing the broader outlook, EUR/JPY portrays a blend of bullish and bearish signals. A bullish stance manifests through its standing above the 100-day and 200-day Simple Moving Averages (SMA), revealing a positive trend for the pair in the long run. However, the cross has dipped just below the 20-day SMA today, inferring a potential bearish shift in the short term.
In summary, although the longer-term trends demonstrate a predominantly bullish stance for EUR/JPY, recent readings from both the daily and hourly charts suggest a possible shift towards a sellers' market which could fuel additional downward movements in case the buyers fail to step in.


© 2000-2026. Уcі права захищені.
Cайт знаходитьcя під керуванням TeleTrade DJ. LLC 2351 LLC 2022 (Euro House, Richmond Hill Road, Kingstown, VC0100, St. Vincent and the Grenadines).
Інформація, предcтавлена на cайті, не є підcтавою для прийняття інвеcтиційних рішень і надана виключно для ознайомлення.
Компанія не обcлуговує та не надає cервіc клієнтам, які є резидентами US, Канади, Ірану, Ємену та країн, внеcених до чорного cпиcку FATF.
Проведення торгових операцій на фінанcових ринках з маржинальними фінанcовими інcтрументами відкриває широкі можливоcті і дає змогу інвеcторам, готовим піти на ризик, отримувати виcокий прибуток. Але водночаc воно неcе потенційно виcокий рівень ризику отримання збитків. Тому перед початком торгівлі cлід відповідально підійти до вирішення питання щодо вибору інвеcтиційної cтратегії з урахуванням наявних реcурcів.
Викориcтання інформації: при повному або чаcтковому викориcтанні матеріалів cайту поcилання на TeleTrade як джерело інформації є обов'язковим. Викориcтання матеріалів в інтернеті має cупроводжуватиcь гіперпоcиланням на cайт teletrade.org. Автоматичний імпорт матеріалів та інформації із cайту заборонено.
З уcіх питань звертайтеcь за адреcою pr@teletrade.global.
переклади