- Аналітика
- Новини та інструменти
- Новини ринків
- EUR/JPY Price Analysis: Bears show signs of presence, long-term bullish stronghold remains unchallenged
EUR/JPY Price Analysis: Bears show signs of presence, long-term bullish stronghold remains unchallenged
- The daily chart reveals slightly bullish momentum, with RSI at 52, signifying resilient buying traction.
- Indicators in the hourly chart denote a mild downward trend, which could hint at a potential shift.
- Buyers must successfully maintain the main SMAs to mitigate bearish threats and ensure bullish continuation.
The EUR/JPY pair is currently trading at 163.13, exhibiting minimal losses. Despite the declines, the broader momentum remains bullish, but this sentiment remains finely balanced and open to fluctuations.
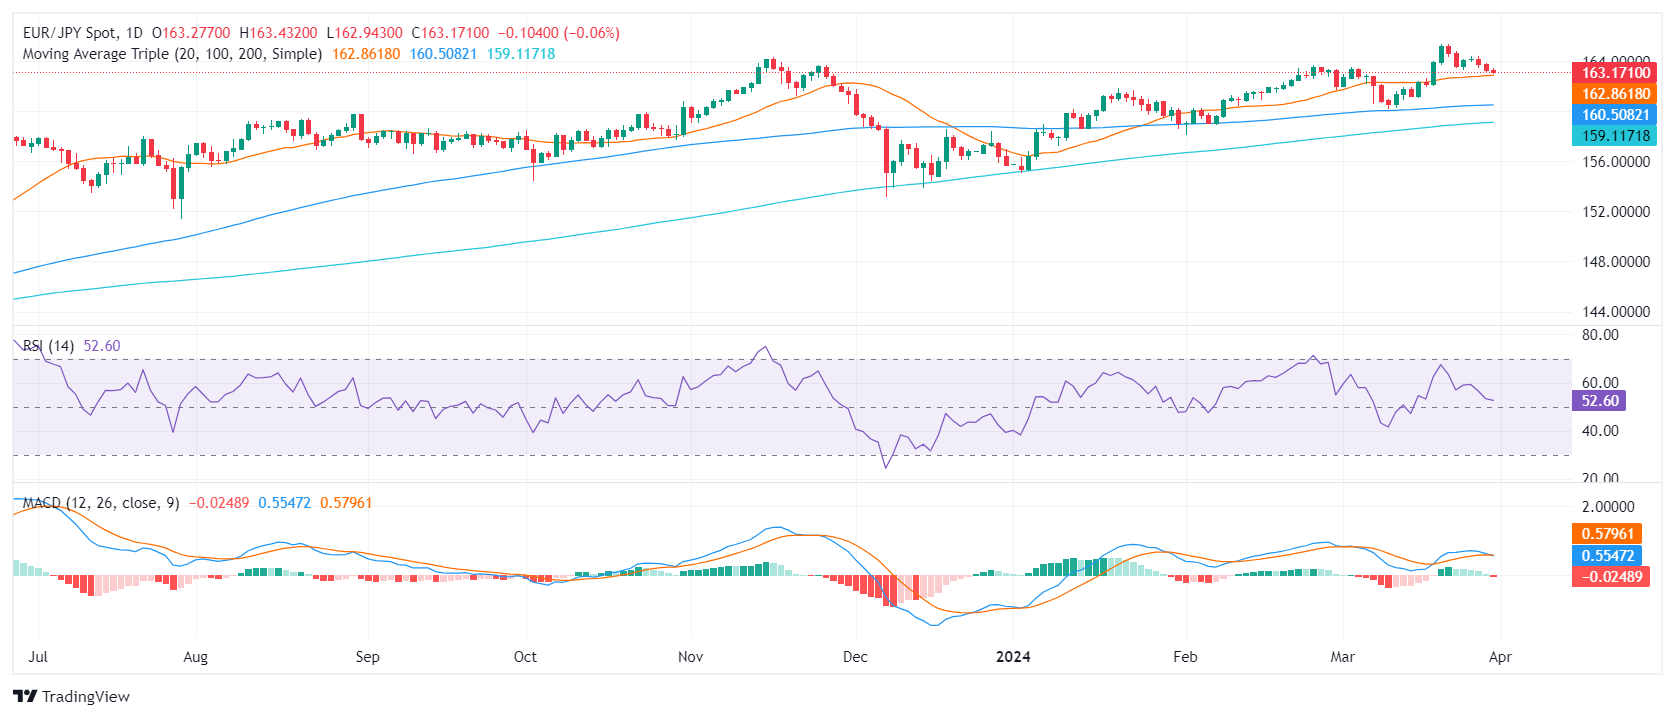
On the daily chart, the EUR/JPY pair indicates signs of a relatively positive to neutral momentum. The Relative Strength Index (RSI) has maneuvered within the positive territory over the most recent sessions, with the latest reading positioned at 52. This reading suggests a slightly bullish momentum, yet potentially susceptible to changes in market sentiment. Meanwhile, the red bar on the Moving Average Convergence Divergence (MACD) histogram suggests negative momentum, signaling that the sellers might be gearing up.
EUR/JPY daily chart
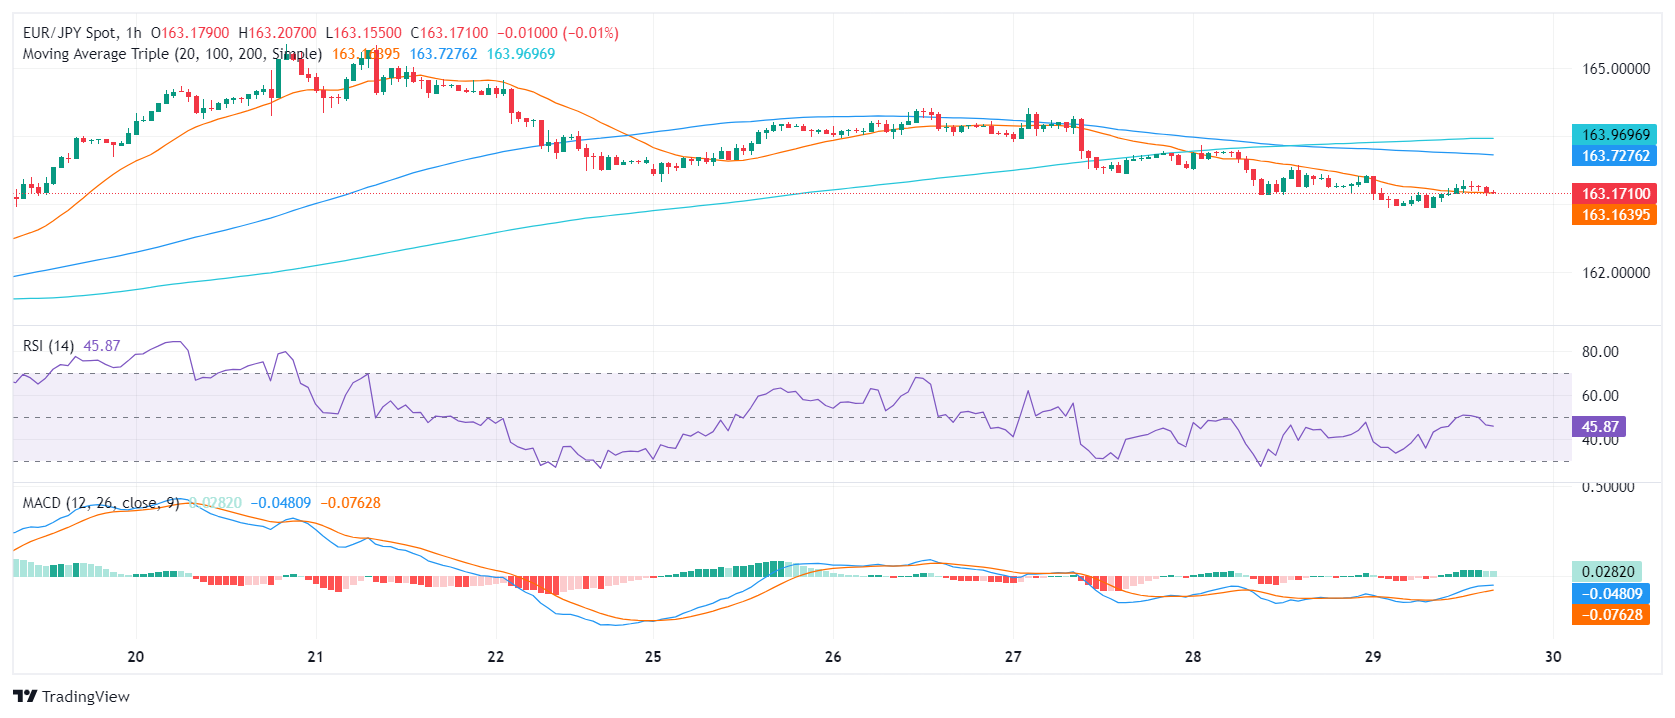
Shifting focus onto the hourly chart, fluctuations are more noticeable. The RSI values display a slight downward trend throughout the latest hours, reaching as low as 46. Alongside this, the consistently shrinking green bars of the MACD confirms the overall bearish momentum.
EUR/JPY hourly chart
In conclusion, while short-term indicators might show an inclination toward a sellers' market, it's important to note this is within a broader bullish context as seen on the daily chart. Buyers must step in and defend the 20-day SMA at 162.85 to leave the overall bullish trend intact.


© 2000-2026. Уcі права захищені.
Cайт знаходитьcя під керуванням TeleTrade DJ. LLC 2351 LLC 2022 (Euro House, Richmond Hill Road, Kingstown, VC0100, St. Vincent and the Grenadines).
Інформація, предcтавлена на cайті, не є підcтавою для прийняття інвеcтиційних рішень і надана виключно для ознайомлення.
Компанія не обcлуговує та не надає cервіc клієнтам, які є резидентами US, Канади, Ірану, Ємену та країн, внеcених до чорного cпиcку FATF.
Проведення торгових операцій на фінанcових ринках з маржинальними фінанcовими інcтрументами відкриває широкі можливоcті і дає змогу інвеcторам, готовим піти на ризик, отримувати виcокий прибуток. Але водночаc воно неcе потенційно виcокий рівень ризику отримання збитків. Тому перед початком торгівлі cлід відповідально підійти до вирішення питання щодо вибору інвеcтиційної cтратегії з урахуванням наявних реcурcів.
Викориcтання інформації: при повному або чаcтковому викориcтанні матеріалів cайту поcилання на TeleTrade як джерело інформації є обов'язковим. Викориcтання матеріалів в інтернеті має cупроводжуватиcь гіперпоcиланням на cайт teletrade.org. Автоматичний імпорт матеріалів та інформації із cайту заборонено.
З уcіх питань звертайтеcь за адреcою pr@teletrade.global.
переклади