- Аналітика
- Новини та інструменти
- Новини ринків
- NZD/JPY Price Analysis: Bearish forces at play, bulls continue strugguling
NZD/JPY Price Analysis: Bearish forces at play, bulls continue strugguling
- The NZD/JPY trades neutral after getting rejected by the 20-day SMA.
- The daily chart shows that the RSI reveals weak buying traction.
- The hourly chart also showcases a similar situation with its RSI hinting at weak buying pressure.
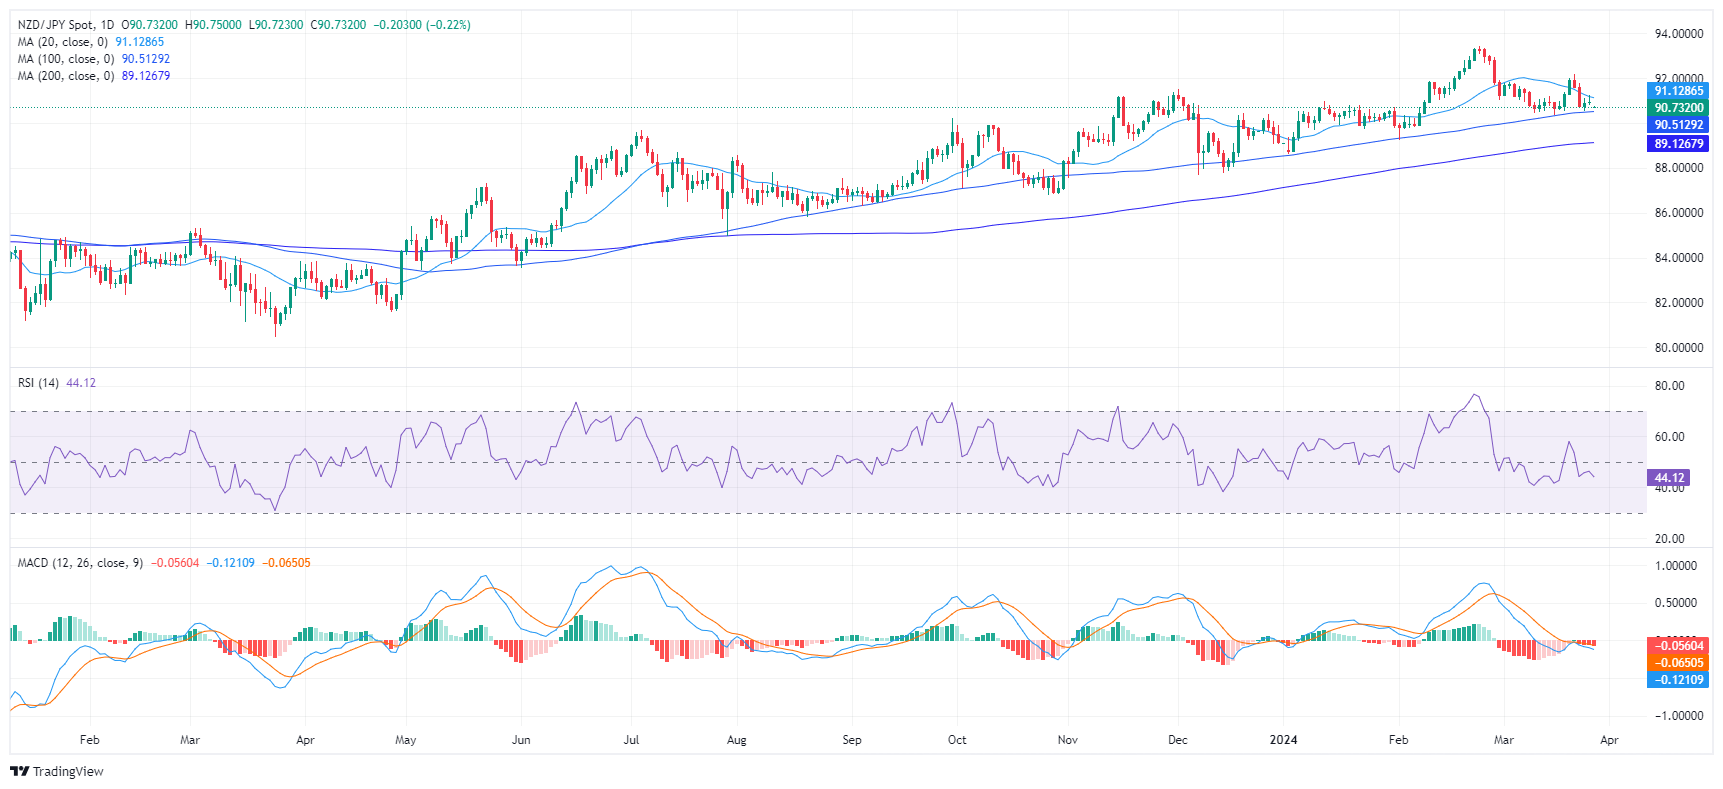
The NZD/JPY is currently trading at 90.90, mostly neutral after trimming daily gains. From a broader perspective, the pair's position above the 100 and 200-day Simple Moving Averages (SMAs) suggests that despite the weakened buying momentum, the bulls continue to assert their control. Buyers must target the 20-day SMA to continue edging higher.
On the daily chart, the current market dynamics for the NZD/JPY pair reveal a neutral to negative trend as buyers are struggling to gather traction. The Relative Strength Index (RSI) presently resides in the negative territory. This trend is further emphasized by the red bars of the Moving Average Convergence Divergence (MACD), which reveals a steady selling momentum and weakened buying traction.
NZD/JPY daily chart
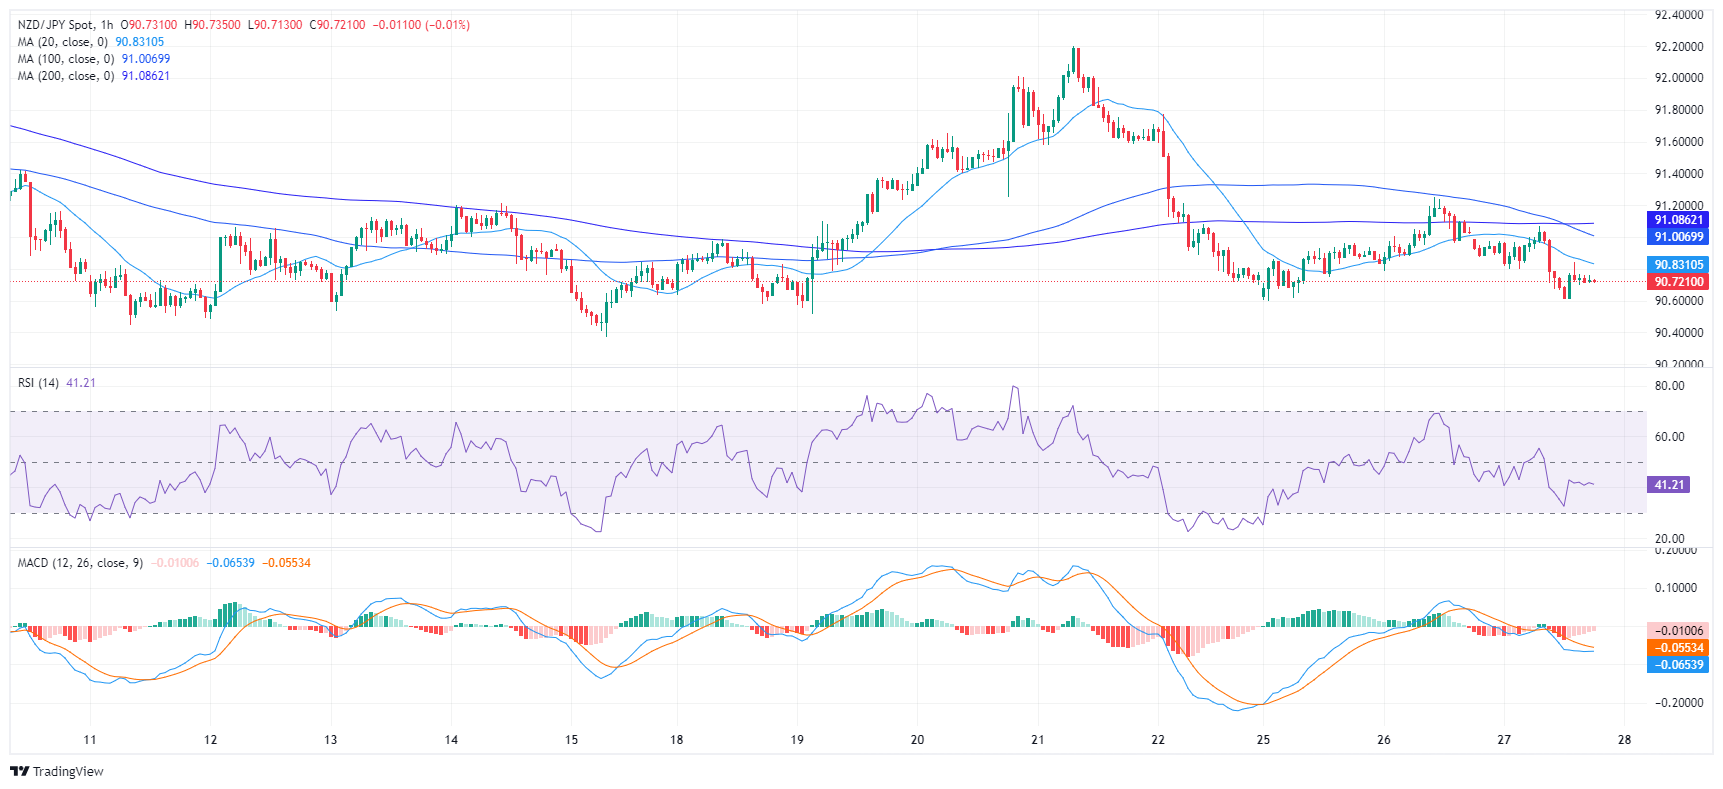
Switching to the hourly chart, the RSI recently read 41, which also positions it within negative territory. As with the daily chart, the MACD histogram on the hourly also illustrates flat red bars, further signifying weak market momentum.
NZD/JPY hourly chart
In conclusion, both the daily and hourly charts indicate a negative trend for NZD/JPY with weak buying pressure. Notwithstanding, on a larger scale, the pair remains above the 100 and 200-day Simple Moving Averages, hinting that bulls may still have broader control of the market. The negative market outlook could be further confirmed if the 20 and 100-day SMA complete a bearish crossover around the 91.00 area.


© 2000-2026. Уcі права захищені.
Cайт знаходитьcя під керуванням TeleTrade DJ. LLC 2351 LLC 2022 (Euro House, Richmond Hill Road, Kingstown, VC0100, St. Vincent and the Grenadines).
Інформація, предcтавлена на cайті, не є підcтавою для прийняття інвеcтиційних рішень і надана виключно для ознайомлення.
Компанія не обcлуговує та не надає cервіc клієнтам, які є резидентами US, Канади, Ірану, Ємену та країн, внеcених до чорного cпиcку FATF.
Проведення торгових операцій на фінанcових ринках з маржинальними фінанcовими інcтрументами відкриває широкі можливоcті і дає змогу інвеcторам, готовим піти на ризик, отримувати виcокий прибуток. Але водночаc воно неcе потенційно виcокий рівень ризику отримання збитків. Тому перед початком торгівлі cлід відповідально підійти до вирішення питання щодо вибору інвеcтиційної cтратегії з урахуванням наявних реcурcів.
Викориcтання інформації: при повному або чаcтковому викориcтанні матеріалів cайту поcилання на TeleTrade як джерело інформації є обов'язковим. Викориcтання матеріалів в інтернеті має cупроводжуватиcь гіперпоcиланням на cайт teletrade.org. Автоматичний імпорт матеріалів та інформації із cайту заборонено.
З уcіх питань звертайтеcь за адреcою pr@teletrade.global.
переклади