- Аналітика
- Новини та інструменти
- Новини ринків
- AUD/JPY Price Analysis: Bears show momentary dominance, long-term bullish tilt remains
AUD/JPY Price Analysis: Bears show momentary dominance, long-term bullish tilt remains
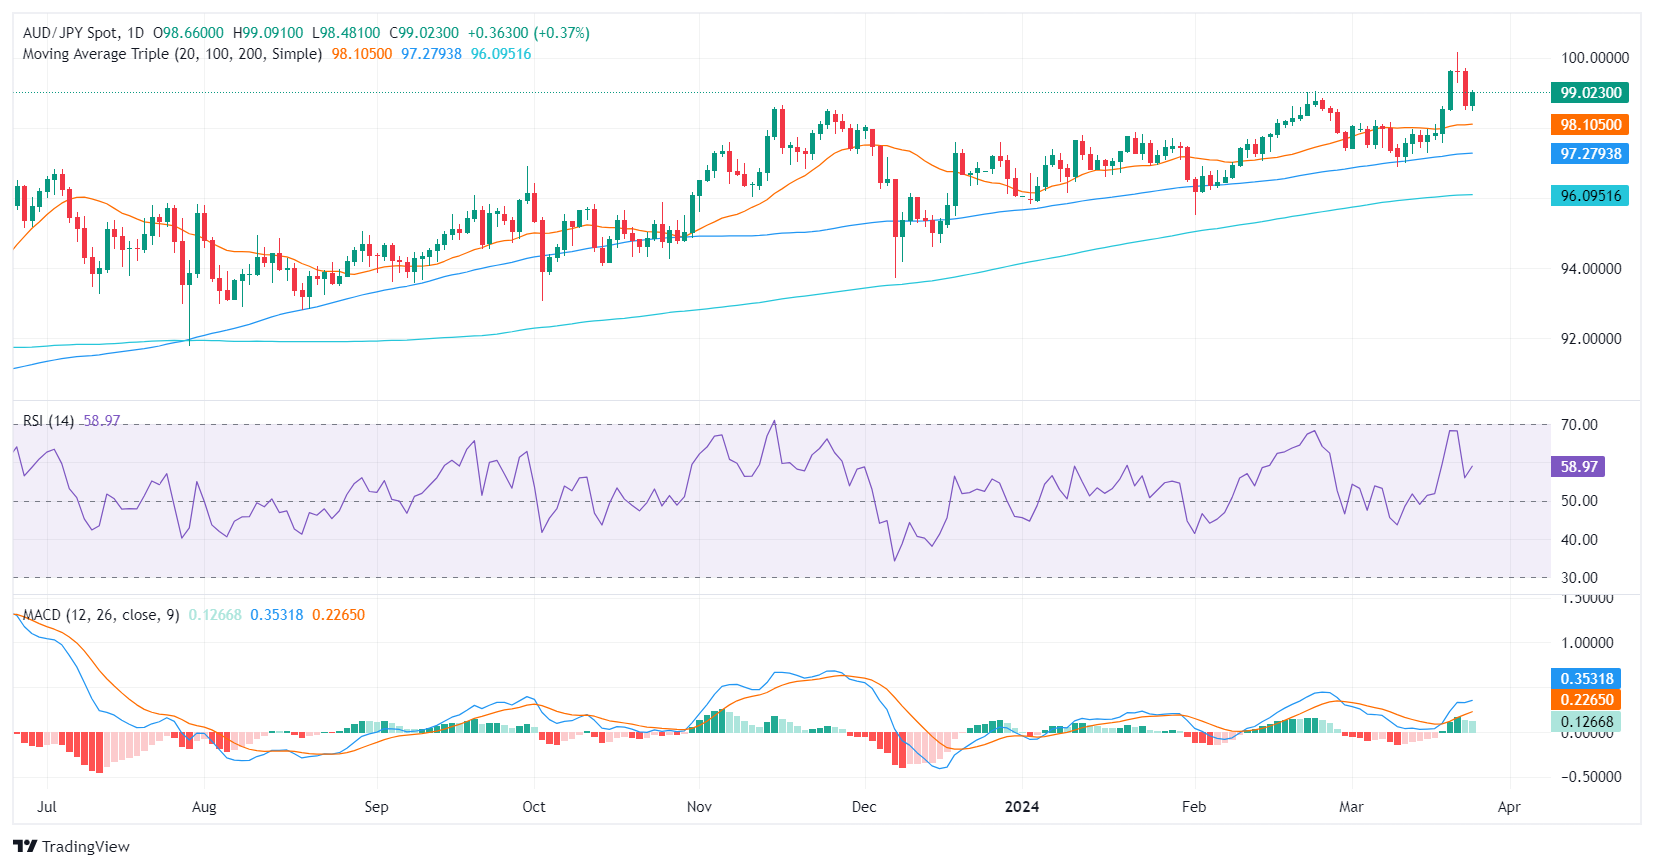
- The daily chart shows a mild bullish momentum as indicated by the RSI, whereas the MACD signals a balanced market environment.
- On the hourly chart, growing selling pressure is evident.
In Tuesday's session, AUD/JPY was seen declining to 98.95, marking mild losses. Despite the insignificant setback, neither buyers nor sellers have gained a distinct advantage, indicating potential market stability or a possible shift in direction. While signs of selling pressure are evident, the pair exhibits a strong stand over the 20,100 and 200-day Simple Moving Averages (SMAs), signifying long-term bullish sentiment. That being said, there are signals that the sellers are present after pushing the pair down by nearly 1% last Friday.
On the daily chart, the Relative Strength Index (RSI) stands with a neutral slope. The flattening trend and the green bars of the Moving Average Convergence Divergence (MACD) hint that the market remains largely balanced, with neither buyers nor sellers having a distinct edge on Tuesday.
AUD/JPY daily chart
Moving onto the hourly chart, the RSI trajectory appears slightly bearish, with recent readings below 50, suggesting mounting selling pressure. The rising red MACD histogram bars further confirm the existing negative momentum.
AUD/JPY hourly chart
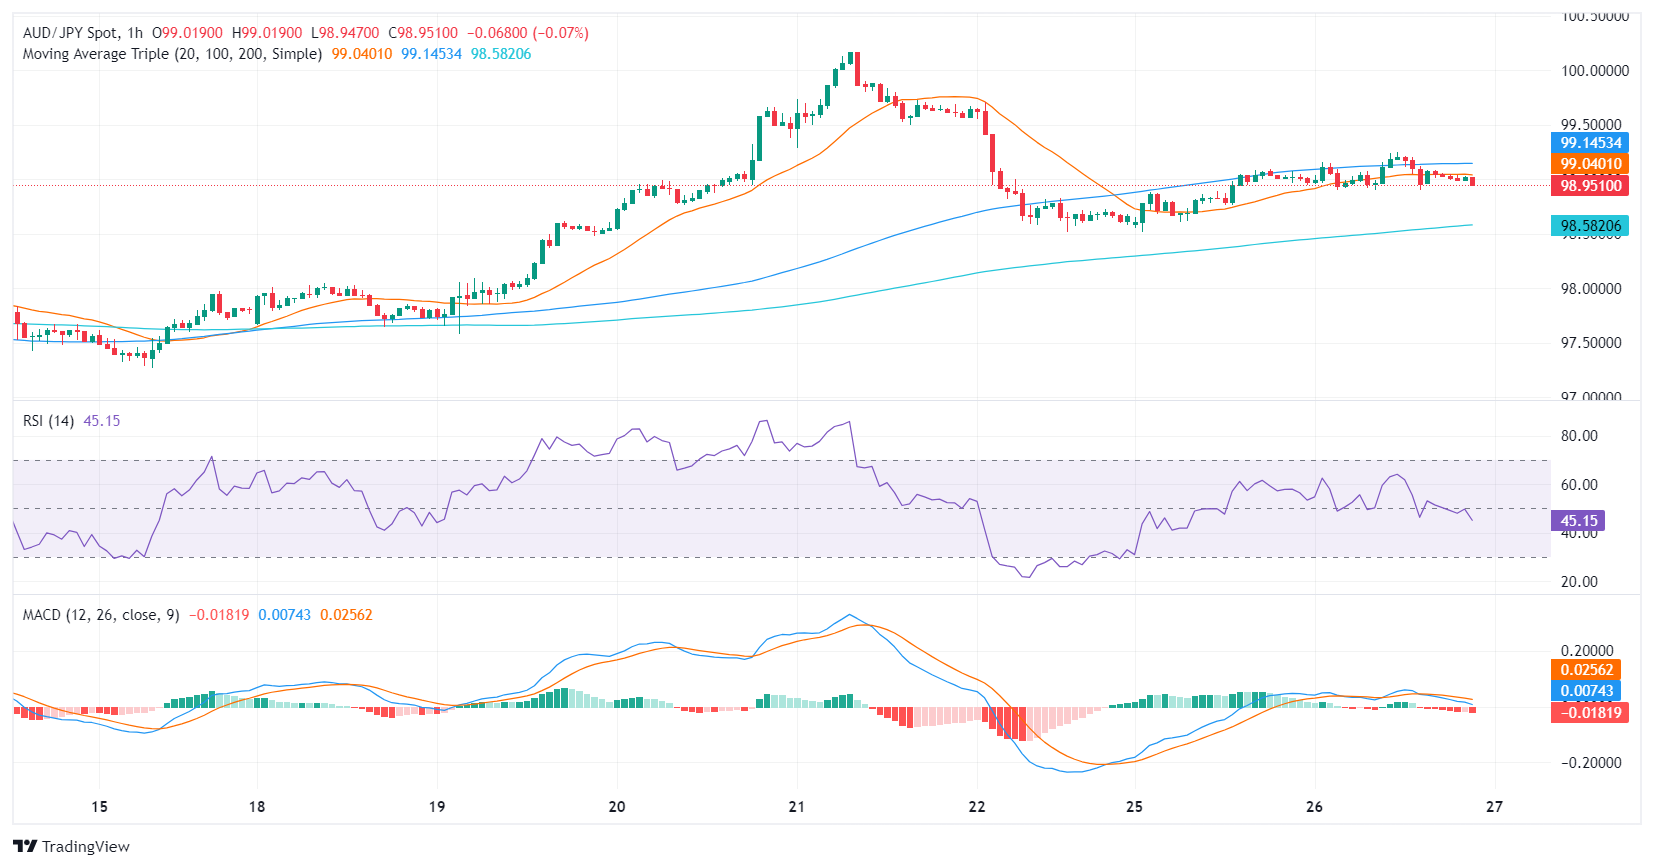
When assessing both charts, the short-term outlook seems to contrast with the daily chart's indications, which appear less bearish. It is evident that the bears are taking a breather following last week’s strong downward movements, but are still around the corner. However, the 1% dip seen on Friday, hasn’t affected yet the overall bullish trend.


© 2000-2026. Уcі права захищені.
Cайт знаходитьcя під керуванням TeleTrade DJ. LLC 2351 LLC 2022 (Euro House, Richmond Hill Road, Kingstown, VC0100, St. Vincent and the Grenadines).
Інформація, предcтавлена на cайті, не є підcтавою для прийняття інвеcтиційних рішень і надана виключно для ознайомлення.
Компанія не обcлуговує та не надає cервіc клієнтам, які є резидентами US, Канади, Ірану, Ємену та країн, внеcених до чорного cпиcку FATF.
Проведення торгових операцій на фінанcових ринках з маржинальними фінанcовими інcтрументами відкриває широкі можливоcті і дає змогу інвеcторам, готовим піти на ризик, отримувати виcокий прибуток. Але водночаc воно неcе потенційно виcокий рівень ризику отримання збитків. Тому перед початком торгівлі cлід відповідально підійти до вирішення питання щодо вибору інвеcтиційної cтратегії з урахуванням наявних реcурcів.
Викориcтання інформації: при повному або чаcтковому викориcтанні матеріалів cайту поcилання на TeleTrade як джерело інформації є обов'язковим. Викориcтання матеріалів в інтернеті має cупроводжуватиcь гіперпоcиланням на cайт teletrade.org. Автоматичний імпорт матеріалів та інформації із cайту заборонено.
З уcіх питань звертайтеcь за адреcою pr@teletrade.global.
переклади