- Analytics
- News and Tools
- Market News
- AUD/USD Price Analysis: Bearish momentum holds steady, bulls remain weak
AUD/USD Price Analysis: Bearish momentum holds steady, bulls remain weak
- The daily RSI reveals a potential increase in bearish momentum if the index remains below 50.
- Under key SMAs on the daily chart, the pair signals rising selling traction, requiring buyers to recover these significant levels.
- After the intense losses on Friday, indicators are consolidating in negative territory.
In Tuesday's session, the AUD/USD observed slight bearish momentum, declining towards 0.6535. The broader outlook reveals that the bears exhibit a somewhat stronger presence, which could maintain a certain level of pressure on the pair. Bears seem to have taken a breather after declining by nearly 0.84% last Friday, but the outlook is still tilted to the short-term downside.
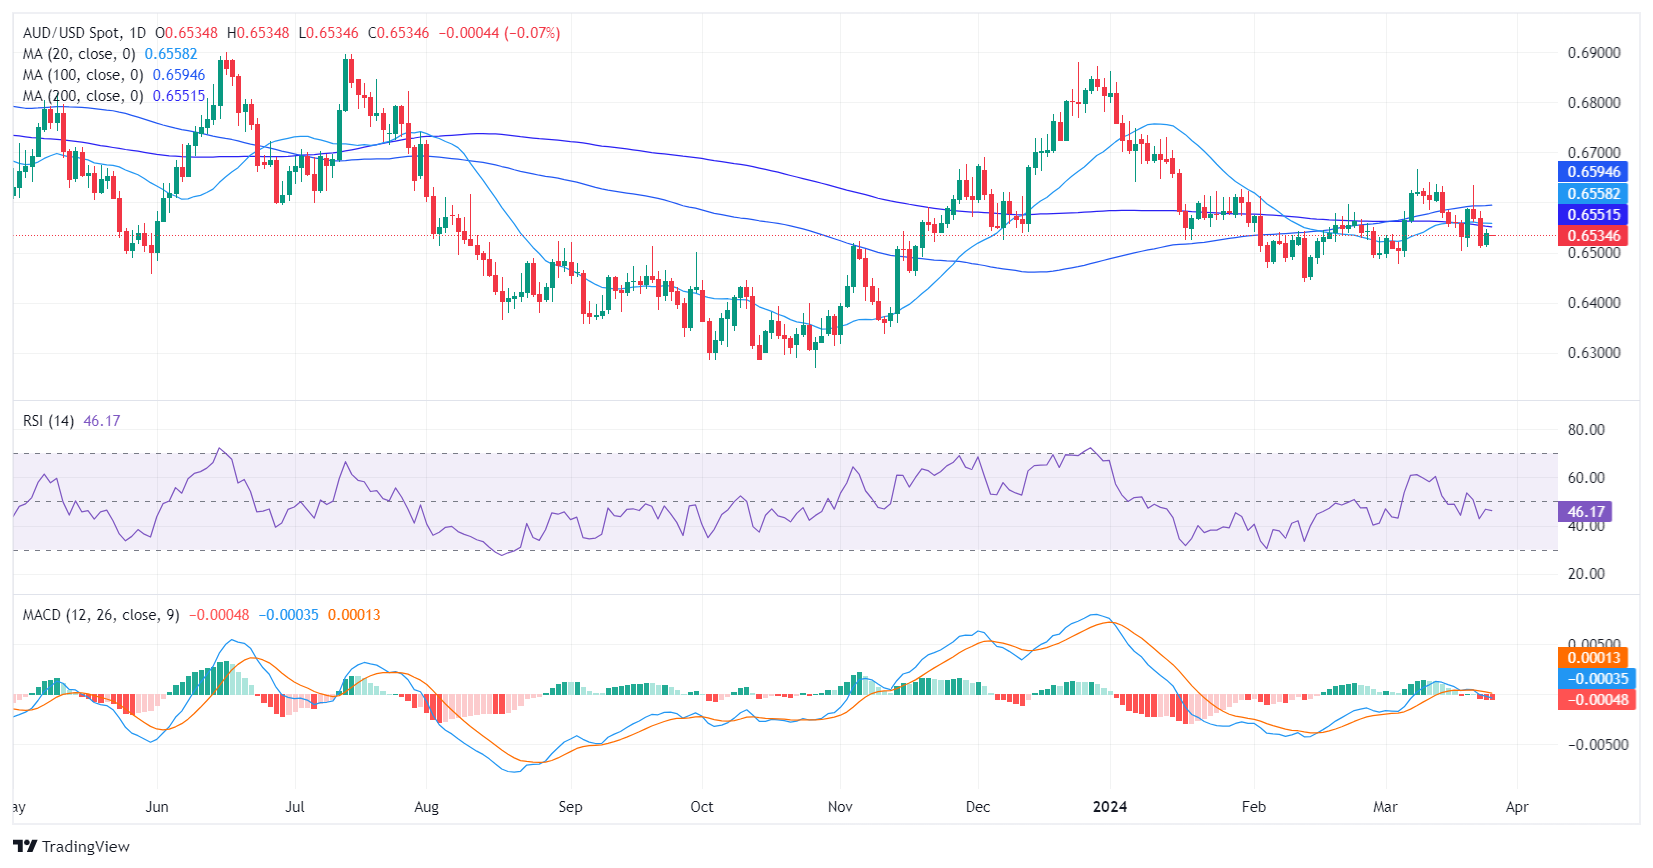
The Relative Strength Index (RSI) presents a negative landscape on the daily chart. The indicator resides in the negative territory with the latest reading just shy of 47. Although currently avoiding oversold conditions, the slight decline in the index is noticeable indicating a continuation of the bearish momentum if the RSI persists below 50. The Moving Average Convergence Divergence (MACD) lays out rising red bars which tends to suggest a mounting selling pressure.
AUD/USD daily chart
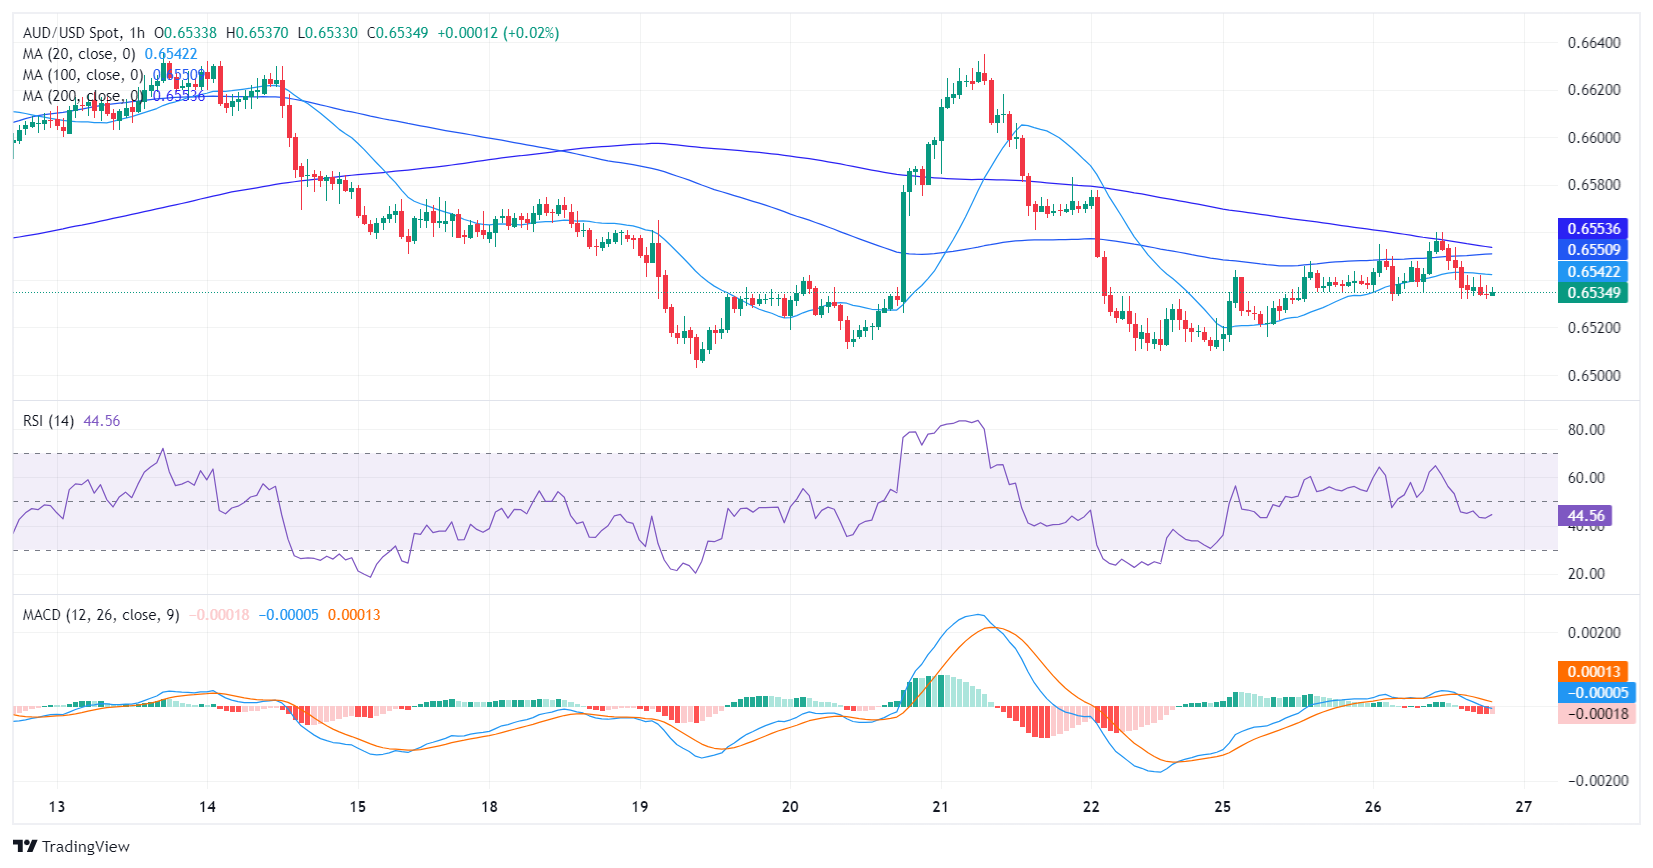
Turning the attention to an intraday perspective, the hourly chart reveals a similar trajectory but on a tighter scale. The hourly RSI has just dipped below 45, reinforcing a stronger bearish undertone into the most recent session. The MACD histogram further supports this outlook, with its red bars indicating the presence of negative momentum.
AUD/USD hourly chart
Surveying the larger context, the pair is below the 20, 100, and 200-day Simple Moving Averages (SMAs) which is a typical signal that the sellers are in control following last Friday’s losses. Overall, indicators seem to have consolidated in negative territory and might continue sideways trading while markets await fresh drivers. In the meantime, bears hold in command.


© 2000-2024. Уcі права захищені.
Cайт знаходитьcя під керуванням TeleTrade DJ. LLC 2351 LLC 2022 (Euro House, Richmond Hill Road, Kingstown, VC0100, St. Vincent and the Grenadines).
Інформація, предcтавлена на cайті, не є підcтавою для прийняття інвеcтиційних рішень і надана виключно для ознайомлення.
Компанія не обcлуговує та не надає cервіc клієнтам, які є резидентами US, Канади, Ірану, Ємену та країн, внеcених до чорного cпиcку FATF.
Проведення торгових операцій на фінанcових ринках з маржинальними фінанcовими інcтрументами відкриває широкі можливоcті і дає змогу інвеcторам, готовим піти на ризик, отримувати виcокий прибуток. Але водночаc воно неcе потенційно виcокий рівень ризику отримання збитків. Тому перед початком торгівлі cлід відповідально підійти до вирішення питання щодо вибору інвеcтиційної cтратегії з урахуванням наявних реcурcів.
Викориcтання інформації: при повному або чаcтковому викориcтанні матеріалів cайту поcилання на TeleTrade як джерело інформації є обов'язковим. Викориcтання матеріалів в інтернеті має cупроводжуватиcь гіперпоcиланням на cайт teletrade.org. Автоматичний імпорт матеріалів та інформації із cайту заборонено.
З уcіх питань звертайтеcь за адреcою pr@teletrade.global.
переклади