- Аналітика
- Новини та інструменти
- Новини ринків
- NZD/USD Price Analysis: Bears maintain control, signs of short-term recovery surface
NZD/USD Price Analysis: Bears maintain control, signs of short-term recovery surface
- Indicators flash oversold conditions on the daily chart.
- Contrarily, hourly chart indicators suggest a slow return of bullish impulse as the bears might have run out of steam.
In Friday's session, the NZD/USD declined just below the 0.6000 threshold, illustrating a bearish outlook as sellers continue to dominate the market. The pair is positioned below its primary Simple Moving Averages (SMAs), further backing the bearish perspective. Technical indicators hint at a strengthening sellers' command but indicators lay in oversold terrain, a typical signal, and the buying momentum might recover.
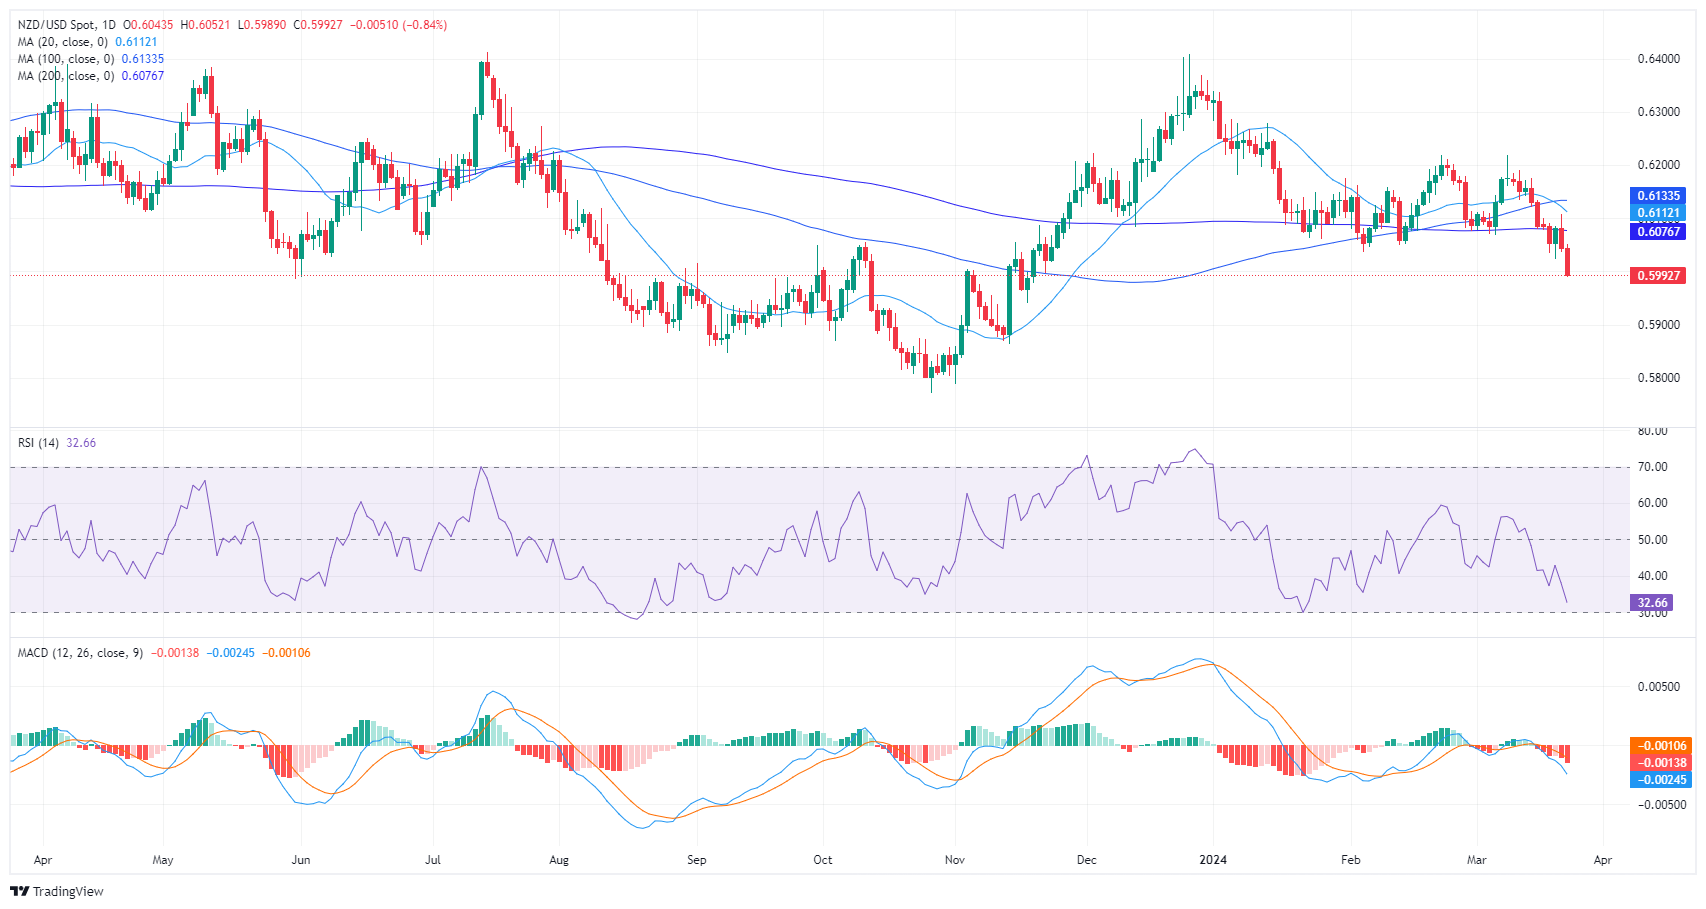
On the daily chart, the Relative Strength Index (RSI) for the NZD/USD pair resides in negative territory presently, indicating a prevailing downtrend as sellers dominate the market. The RSI was reported at 33, bordering on oversold conditions, a potential indication for future corrective movement. The Moving Average Convergence Divergence (MACD) histogram exhibits rising red bars, also confirming the negative momentum.
NZD/USD daily chart
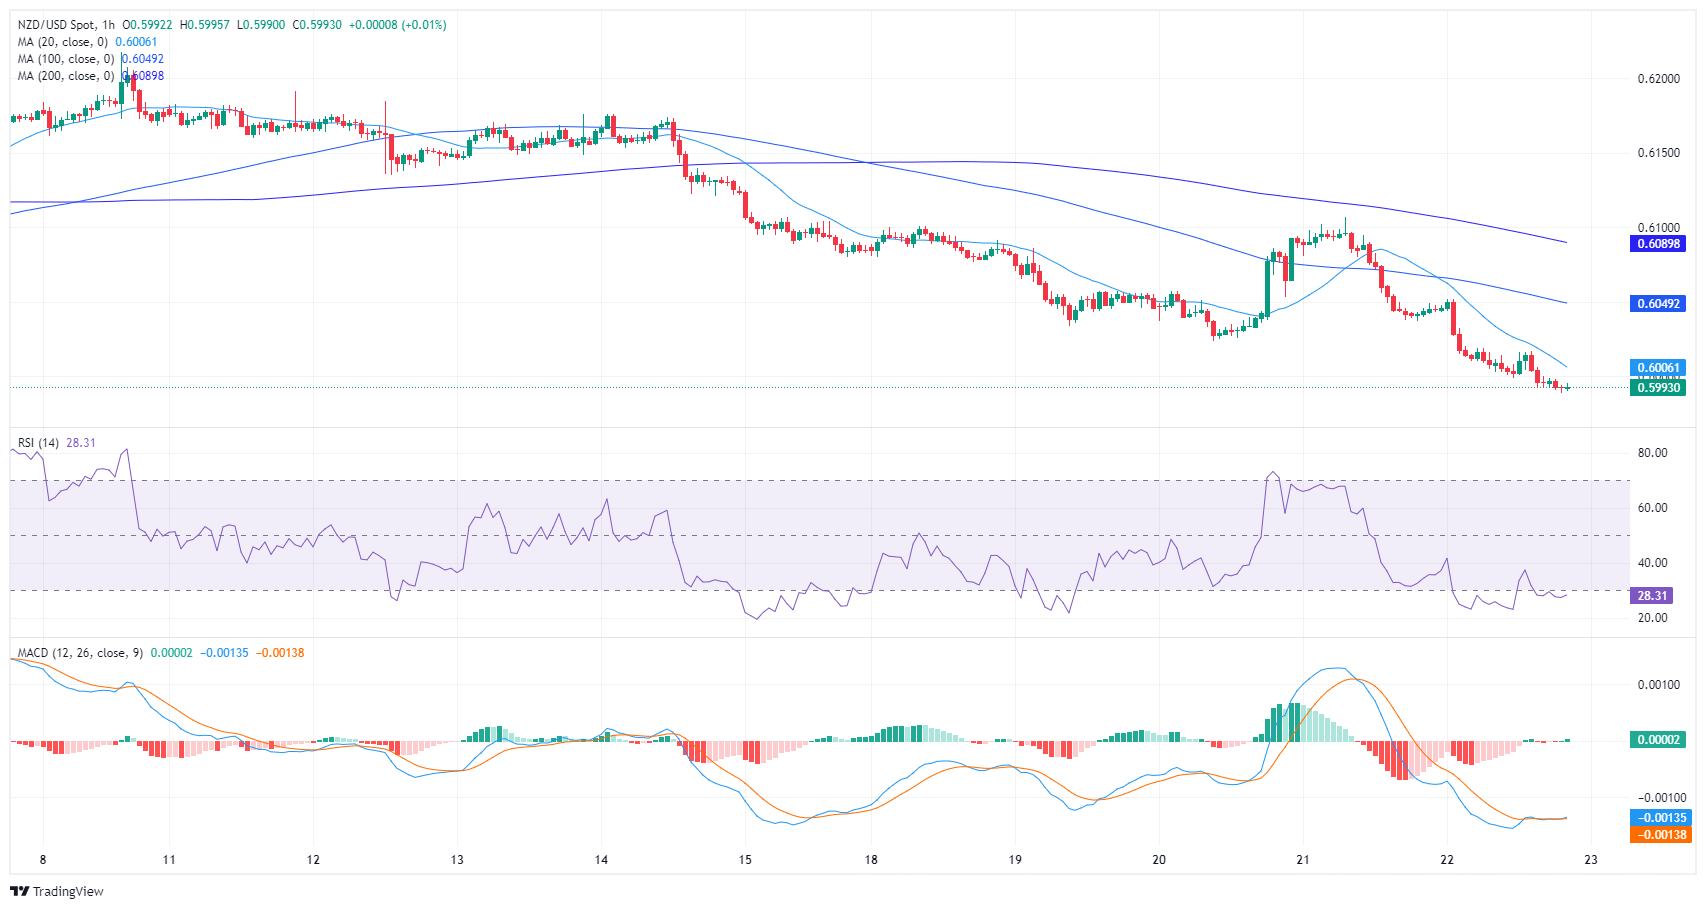
Moving to the hourly chart, the RSI levels convey a relatively similar scenario. The value last rested at 28, corroborating its presence in the oversold territory. Contrarily, the MACD on the hourly chart displays rising green bars, hinting at a creeping positive momentum.
NZD/USD hourly chart
In essence, while the daily chart discloses a persisting bearish momentum, hourly indications of rising positive momentum in the MACD histogram may signal a reprieve from selling pressure. Looking at the broader trend, the pair is below the 20, 100, and 200-day Simple Moving Averages (SMAs), further implying a bearish outlook.


© 2000-2026. Уcі права захищені.
Cайт знаходитьcя під керуванням TeleTrade DJ. LLC 2351 LLC 2022 (Euro House, Richmond Hill Road, Kingstown, VC0100, St. Vincent and the Grenadines).
Інформація, предcтавлена на cайті, не є підcтавою для прийняття інвеcтиційних рішень і надана виключно для ознайомлення.
Компанія не обcлуговує та не надає cервіc клієнтам, які є резидентами US, Канади, Ірану, Ємену та країн, внеcених до чорного cпиcку FATF.
Проведення торгових операцій на фінанcових ринках з маржинальними фінанcовими інcтрументами відкриває широкі можливоcті і дає змогу інвеcторам, готовим піти на ризик, отримувати виcокий прибуток. Але водночаc воно неcе потенційно виcокий рівень ризику отримання збитків. Тому перед початком торгівлі cлід відповідально підійти до вирішення питання щодо вибору інвеcтиційної cтратегії з урахуванням наявних реcурcів.
Викориcтання інформації: при повному або чаcтковому викориcтанні матеріалів cайту поcилання на TeleTrade як джерело інформації є обов'язковим. Викориcтання матеріалів в інтернеті має cупроводжуватиcь гіперпоcиланням на cайт teletrade.org. Автоматичний імпорт матеріалів та інформації із cайту заборонено.
З уcіх питань звертайтеcь за адреcою pr@teletrade.global.
переклади