- Аналітика
- Новини та інструменти
- Новини ринків
- NZD/JPY Price Analysis: Bearish signals intensify short-term, long-term bullish trend remains
NZD/JPY Price Analysis: Bearish signals intensify short-term, long-term bullish trend remains
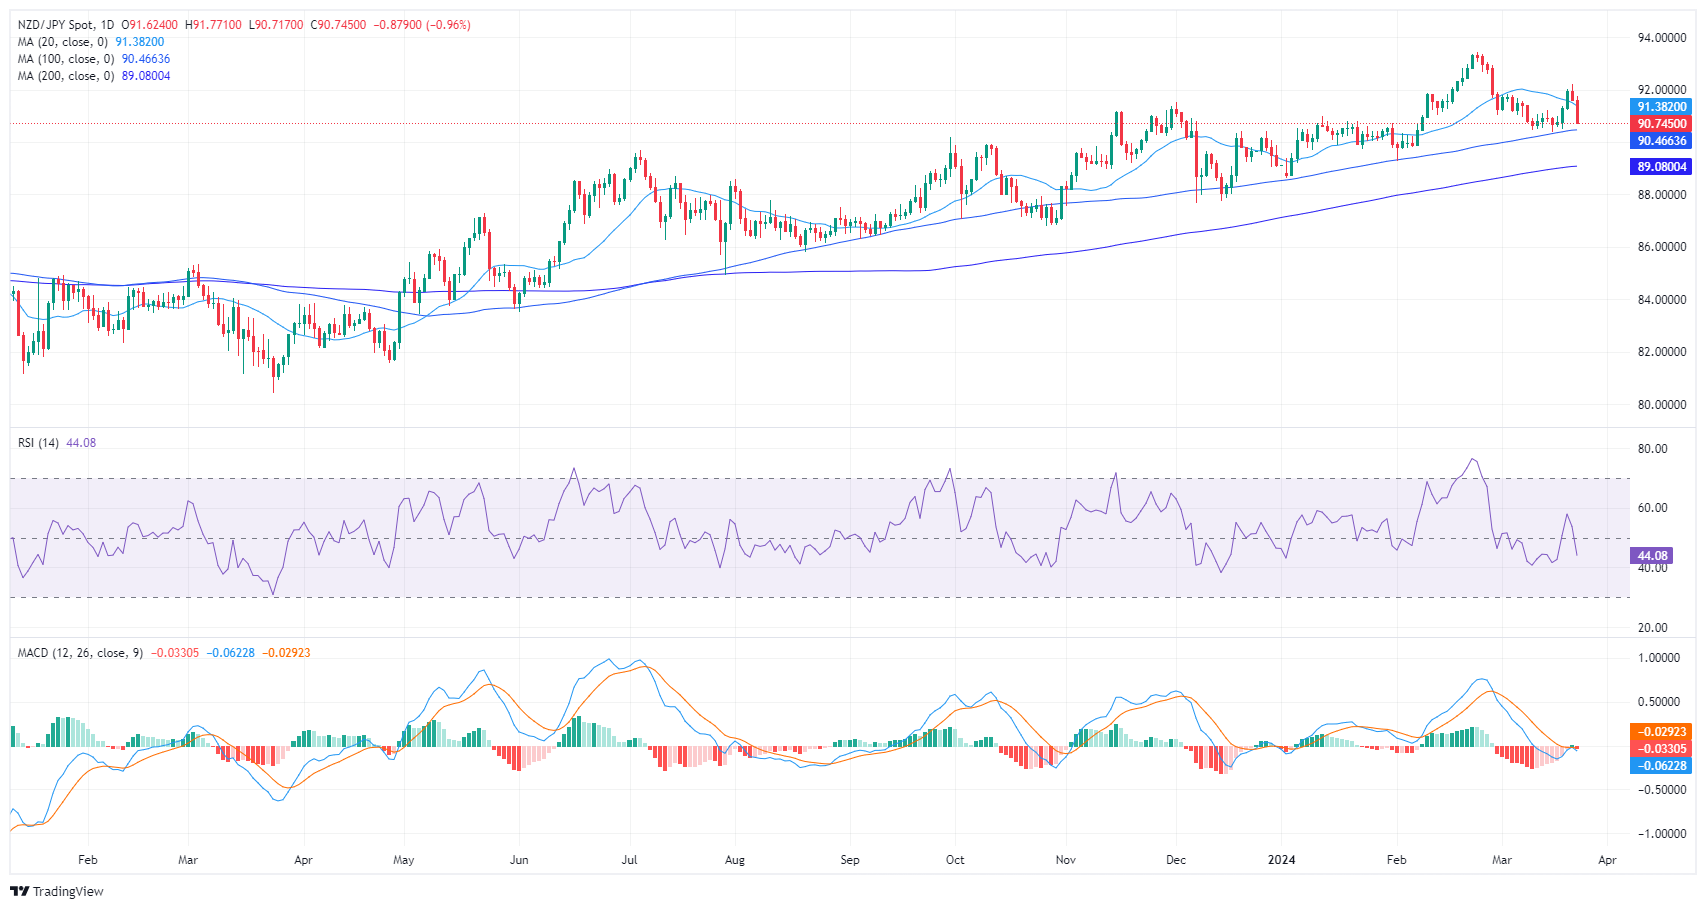
- Bearish pressure intensified on the daily chart, and the pair lost the 20-day SMA.
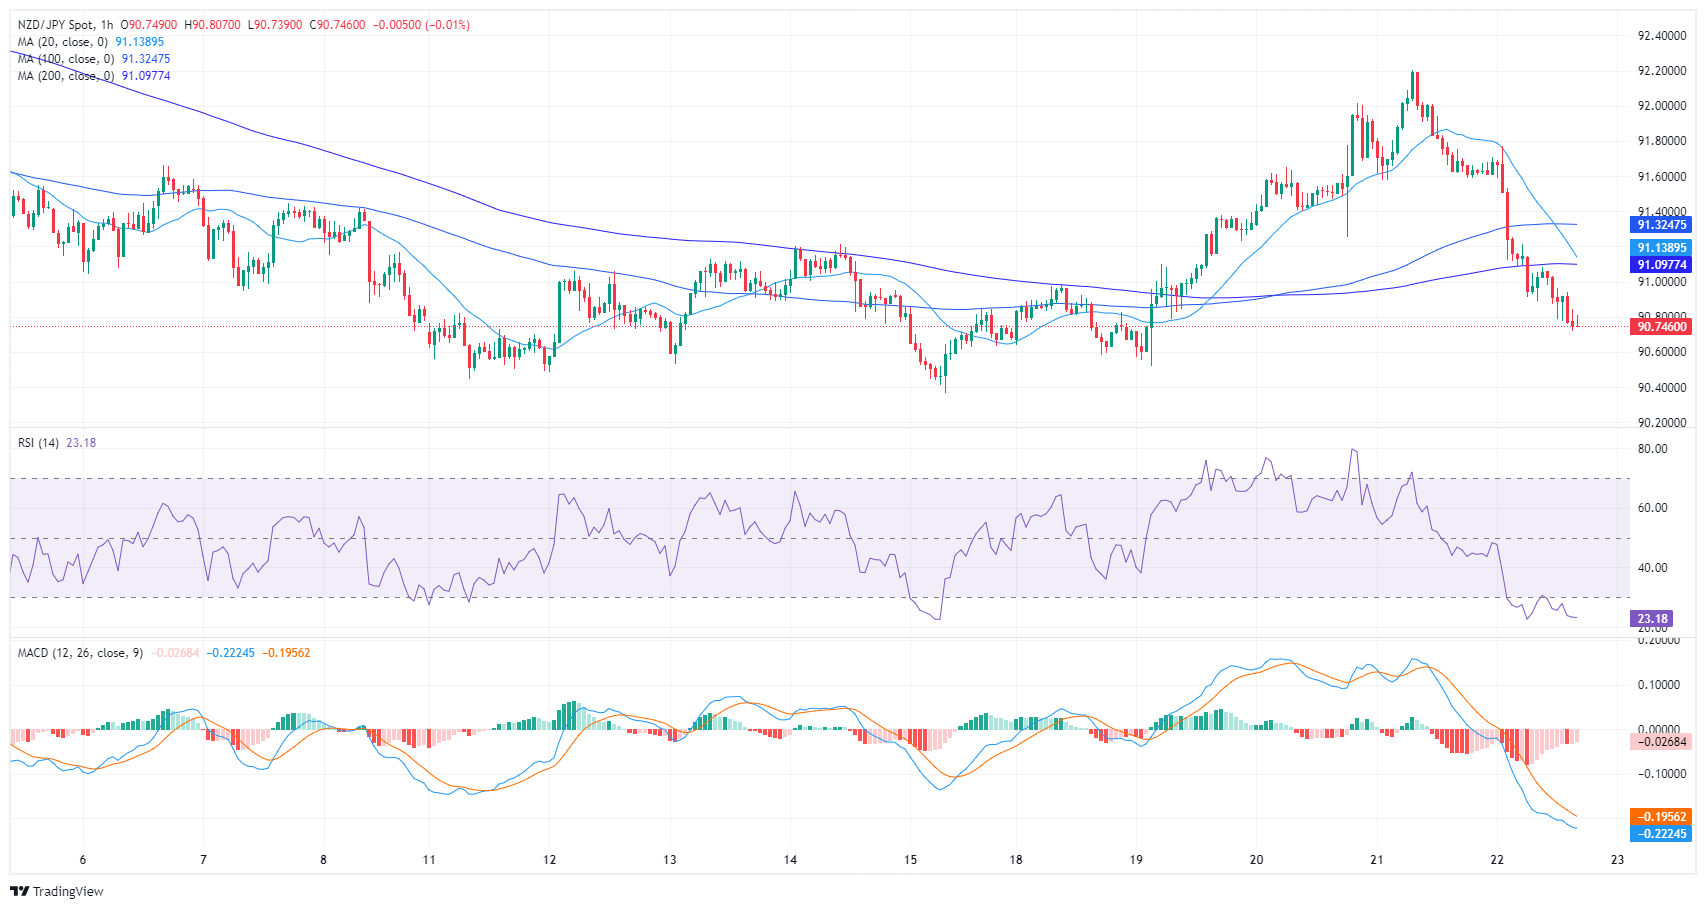
- As the pair lies deeply oversold on the hourly chart, buyers might start taking profits.
The NZD/JPY pair is trading at 90.748, marking a significant dip of 0.98%. Despite the presence of strong selling pressure, the pair persistently resides above its 100 and 200-day Simple Moving Averages (SMAs). This suggests a dominant bullish force in long-term time frames. But the fact the sellers conquered the 20-day average, paints the short-term outlook with a negative tone.
Based on the indicators of the daily chart, some important dynamics can be observed. The Relative Strength Index (RSI), currently at 43, resides in the negative territory. This position, coupled with its falling, suggests a dominance of sellers in the market for now. In addition, the Moving Average Convergence Divergence (MACD) histogram reveals rising red bars, further substantiating the negative momentum.
NZD/JPY daily chart
Shifting to the hourly chart, the RSI shows a value of 23, indicating that the pair is deeply oversold. Compared to the daily chart, an amplified negative trend is apparent. However, the MACD on this shorter time frame similarly showcases flat red bars, emphasizing the current bearish momentum but a less intense grip which might suggest that the pair might start consolidating.
NZD/JPY hourly chart
If the bulls want to maintain the overall bullish trend, they must defend the 100 and 200-day SMAs. In case lost, the bearish pressure might intensify further. In the meantime, they could act as a support for sellers to consolidate their downward movements.


© 2000-2026. Уcі права захищені.
Cайт знаходитьcя під керуванням TeleTrade DJ. LLC 2351 LLC 2022 (Euro House, Richmond Hill Road, Kingstown, VC0100, St. Vincent and the Grenadines).
Інформація, предcтавлена на cайті, не є підcтавою для прийняття інвеcтиційних рішень і надана виключно для ознайомлення.
Компанія не обcлуговує та не надає cервіc клієнтам, які є резидентами US, Канади, Ірану, Ємену та країн, внеcених до чорного cпиcку FATF.
Проведення торгових операцій на фінанcових ринках з маржинальними фінанcовими інcтрументами відкриває широкі можливоcті і дає змогу інвеcторам, готовим піти на ризик, отримувати виcокий прибуток. Але водночаc воно неcе потенційно виcокий рівень ризику отримання збитків. Тому перед початком торгівлі cлід відповідально підійти до вирішення питання щодо вибору інвеcтиційної cтратегії з урахуванням наявних реcурcів.
Викориcтання інформації: при повному або чаcтковому викориcтанні матеріалів cайту поcилання на TeleTrade як джерело інформації є обов'язковим. Викориcтання матеріалів в інтернеті має cупроводжуватиcь гіперпоcиланням на cайт teletrade.org. Автоматичний імпорт матеріалів та інформації із cайту заборонено.
З уcіх питань звертайтеcь за адреcою pr@teletrade.global.
переклади