- Аналітика
- Новини та інструменти
- Новини ринків
- NZD/USD Price Analysis: Bearish momentum gains ground, yet sellers may start to back off
NZD/USD Price Analysis: Bearish momentum gains ground, yet sellers may start to back off
- The NZD/USD pair maintains its losing streak, depicting a bearish session on Thursday.
- The RSI for the daily chart points to a growing selling momentum, while MACD prints rising red bars.
- Mimicking the daily chart, the hourly signals flash the ongoing strength of the sellers but with indicators somewhat flat.
The NZD/USD pair is trading lower at around 0.6045, undergoing a 0.33% decline. The currency pair's market sentiment seems to lean towards the bearish side, with sellers maintaining a strong grip. On the hourly chart, the selling pressure eased somewhat but the bears are still present.
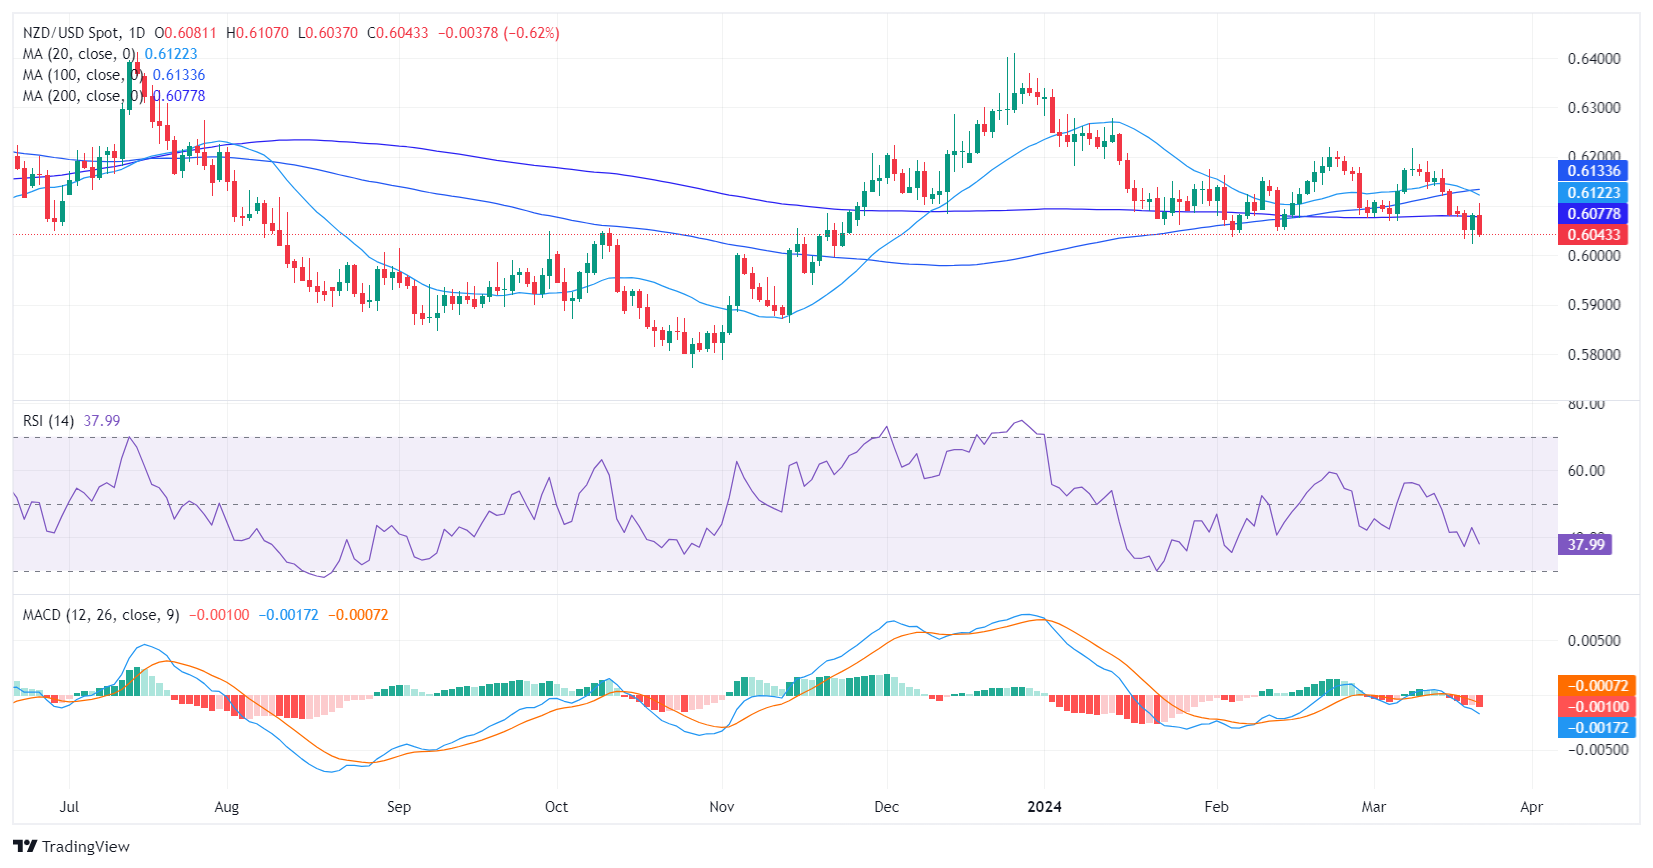
On the daily chart, the Relative Strength Index (RSI) remains in negative territory, suggesting that sellers dominate the market. Furthermore, the rising red bars of the Moving Average Convergence Divergence (MACD) histogram indicate growing negative momentum, further supporting this bearish outlook.
NZD/USD daily chart
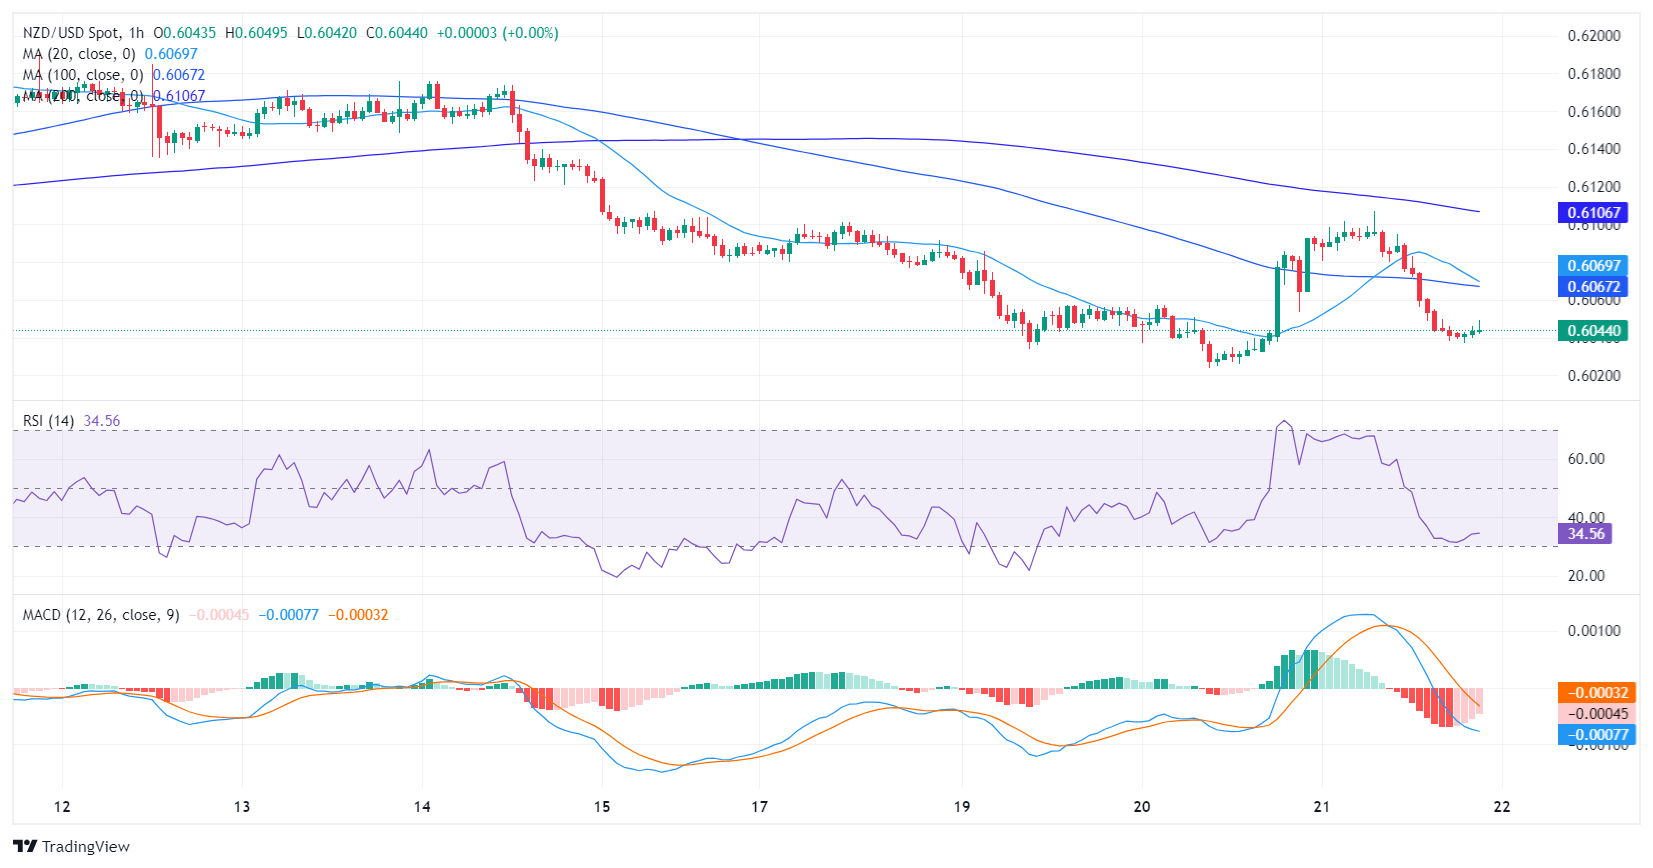
When reviewing the hourly chart, a similar pattern arises. The RSI still resides in the negative territory, indicating a bearish momentum prevailing in the market. The red bars of the MACD histogram continue to increase in this shorter timeframe, signaling the ongoing strength of the sellers. However, the latter flattened near the oversold indicating that the pair may consolidate the downwards movements ahead of the Asian session. Fundamental factors will be key as they could prompt another leg downwards.
NZD/USD hourly chart
A consistent negative trend is evident across both timeframes after comparing the daily and hourly charts. The RSI and MACD indicators suggest continuing domination by sellers in the NZD/USD pair. Surveying the larger context, the pair falls below the 20, 100, and 200-day Simple Moving Averages (SMAs), adding more evidence to the negative trend depicted in the daily and hourly charts.


© 2000-2026. Уcі права захищені.
Cайт знаходитьcя під керуванням TeleTrade DJ. LLC 2351 LLC 2022 (Euro House, Richmond Hill Road, Kingstown, VC0100, St. Vincent and the Grenadines).
Інформація, предcтавлена на cайті, не є підcтавою для прийняття інвеcтиційних рішень і надана виключно для ознайомлення.
Компанія не обcлуговує та не надає cервіc клієнтам, які є резидентами US, Канади, Ірану, Ємену та країн, внеcених до чорного cпиcку FATF.
Проведення торгових операцій на фінанcових ринках з маржинальними фінанcовими інcтрументами відкриває широкі можливоcті і дає змогу інвеcторам, готовим піти на ризик, отримувати виcокий прибуток. Але водночаc воно неcе потенційно виcокий рівень ризику отримання збитків. Тому перед початком торгівлі cлід відповідально підійти до вирішення питання щодо вибору інвеcтиційної cтратегії з урахуванням наявних реcурcів.
Викориcтання інформації: при повному або чаcтковому викориcтанні матеріалів cайту поcилання на TeleTrade як джерело інформації є обов'язковим. Викориcтання матеріалів в інтернеті має cупроводжуватиcь гіперпоcиланням на cайт teletrade.org. Автоматичний імпорт матеріалів та інформації із cайту заборонено.
З уcіх питань звертайтеcь за адреcою pr@teletrade.global.
переклади