- Аналітика
- Новини та інструменти
- Новини ринків
- Silver Price Analysis: XAG/USD tumbles as bearish engulfing pattern looms
Silver Price Analysis: XAG/USD tumbles as bearish engulfing pattern looms
- Silver prices see a significant drop to $24.75, shedding over 3% in response to a strengthening US Dollar.
- Technical analysis reveals a bearish engulfing pattern, despite a recent 'golden cross', signaling mixed signals for traders.
- The RSI indicates diminishing buying pressure, hinting at a potential bearish swing.
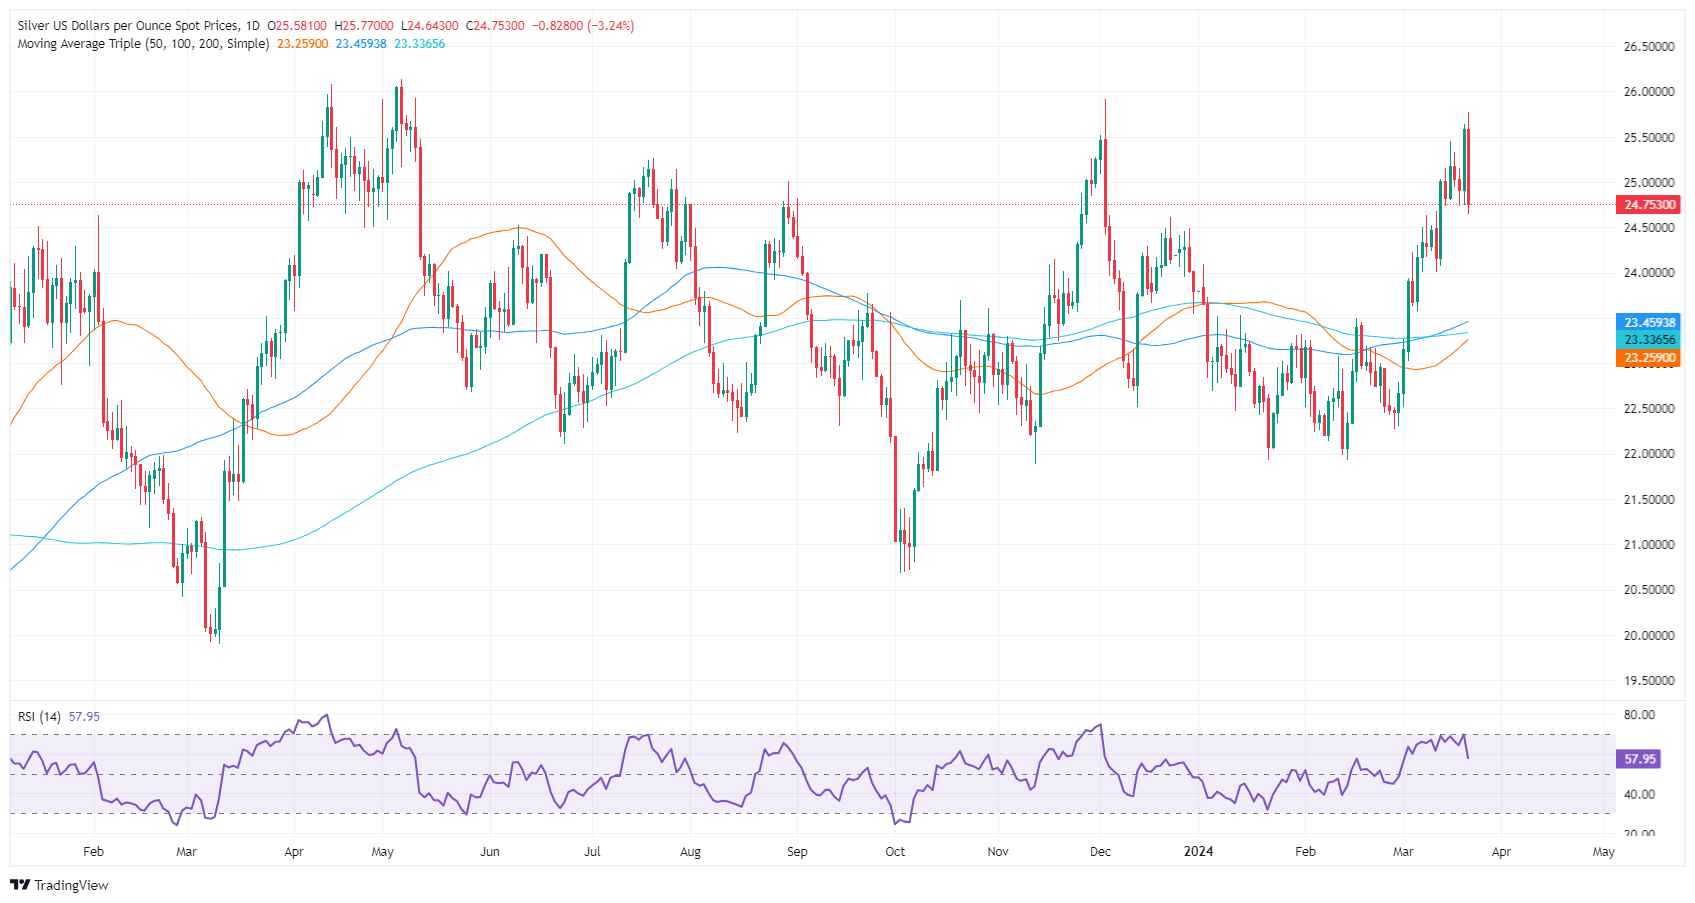
Silver's price plunged on Thursday amidst a risk-off impulse, reinvigorating the US Dollar. Consequently, the grey metal dropped more than $0.70, or 3.15%, as the XAG/USD traded at $24.75 after hitting a daily high of $25.77.
XAG/USD Price Analysis: Technical outlook
Silver is witnessing a downturn, as price action has formed a ‘bearish engulfing’ chart pattern in the last couple of days. Even though the 50-day moving average (DMA) has crossed above the 200-DMA, forming a classic ‘golden cross’ indicating that bulls are gathering steam, momentum suggests the opposite.
The Relative Strength Index (RSI) is hovering just below 60 after peaking around 70, indicating that moderate buying pressure remains. However, the RSI's descent from higher levels suggests that momentum might wane, and bears could gain ground.
The recent pullback has seen the price retreat from resistance near the $26.00 mark. Immediate support is found near December’s 22 high turned support at $24.60, followed by the $24.00 level. A breach of the latter could open a path towards the $23.00 area, marked by the previous cycle lows.
On the other hand, an XAG/USD daily close above $25.00 could pave the way for challenging yearly highs at $25.77, followed by last year’s high at $25.91.
XAG/USD Price Action – Daily Chart


© 2000-2026. Уcі права захищені.
Cайт знаходитьcя під керуванням TeleTrade DJ. LLC 2351 LLC 2022 (Euro House, Richmond Hill Road, Kingstown, VC0100, St. Vincent and the Grenadines).
Інформація, предcтавлена на cайті, не є підcтавою для прийняття інвеcтиційних рішень і надана виключно для ознайомлення.
Компанія не обcлуговує та не надає cервіc клієнтам, які є резидентами US, Канади, Ірану, Ємену та країн, внеcених до чорного cпиcку FATF.
Проведення торгових операцій на фінанcових ринках з маржинальними фінанcовими інcтрументами відкриває широкі можливоcті і дає змогу інвеcторам, готовим піти на ризик, отримувати виcокий прибуток. Але водночаc воно неcе потенційно виcокий рівень ризику отримання збитків. Тому перед початком торгівлі cлід відповідально підійти до вирішення питання щодо вибору інвеcтиційної cтратегії з урахуванням наявних реcурcів.
Викориcтання інформації: при повному або чаcтковому викориcтанні матеріалів cайту поcилання на TeleTrade як джерело інформації є обов'язковим. Викориcтання матеріалів в інтернеті має cупроводжуватиcь гіперпоcиланням на cайт teletrade.org. Автоматичний імпорт матеріалів та інформації із cайту заборонено.
З уcіх питань звертайтеcь за адреcою pr@teletrade.global.
переклади