- Аналітика
- Новини та інструменти
- Новини ринків
- NZD/JPY Price Analysis: Bulls dictate the market rhythm, hinting at temporary selling pressure
NZD/JPY Price Analysis: Bulls dictate the market rhythm, hinting at temporary selling pressure
- On the daily chart, indicators are consolidating but the outlook is favoring the bulls.
- The hourly chart gives hints of mounting selling traction with indicators deep in the red.
The NZD/JPY pair is currently trading at 91.60, slightly down in Thursday's session. Bulls hold a strong command over the market, even amidst transient selling pressure, which seems not to have weakened their movement with the pair holding above the 20,100 and 200-day Simple Moving Averages (SMAs).
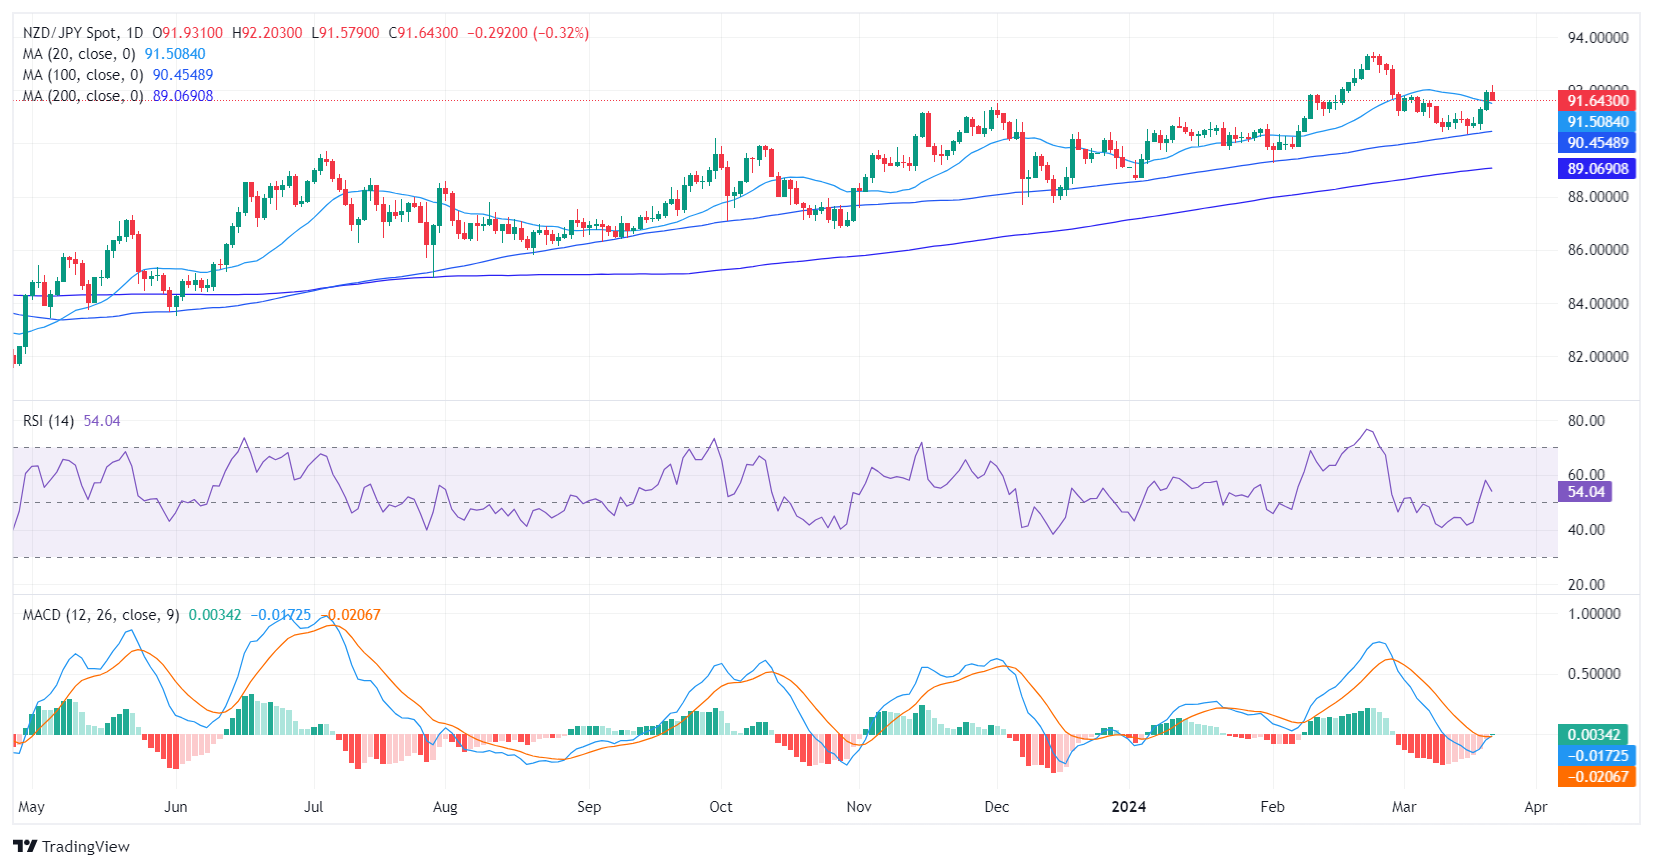
On the daily chart, the NZD/JPY pair reveals an influx of buyers dominating the market, as indicated by the Relative Strength Index (RSI) progressing towards positive territory. The latest reading at 55, sits in the positive zone, but points down, as indicators consolidate. Meanwhile, the Moving Average Convergence Divergence (MACD) reveals a declining trend with red bars, indicating steady but weakening negative momentum.
NZD/JPY daily chart
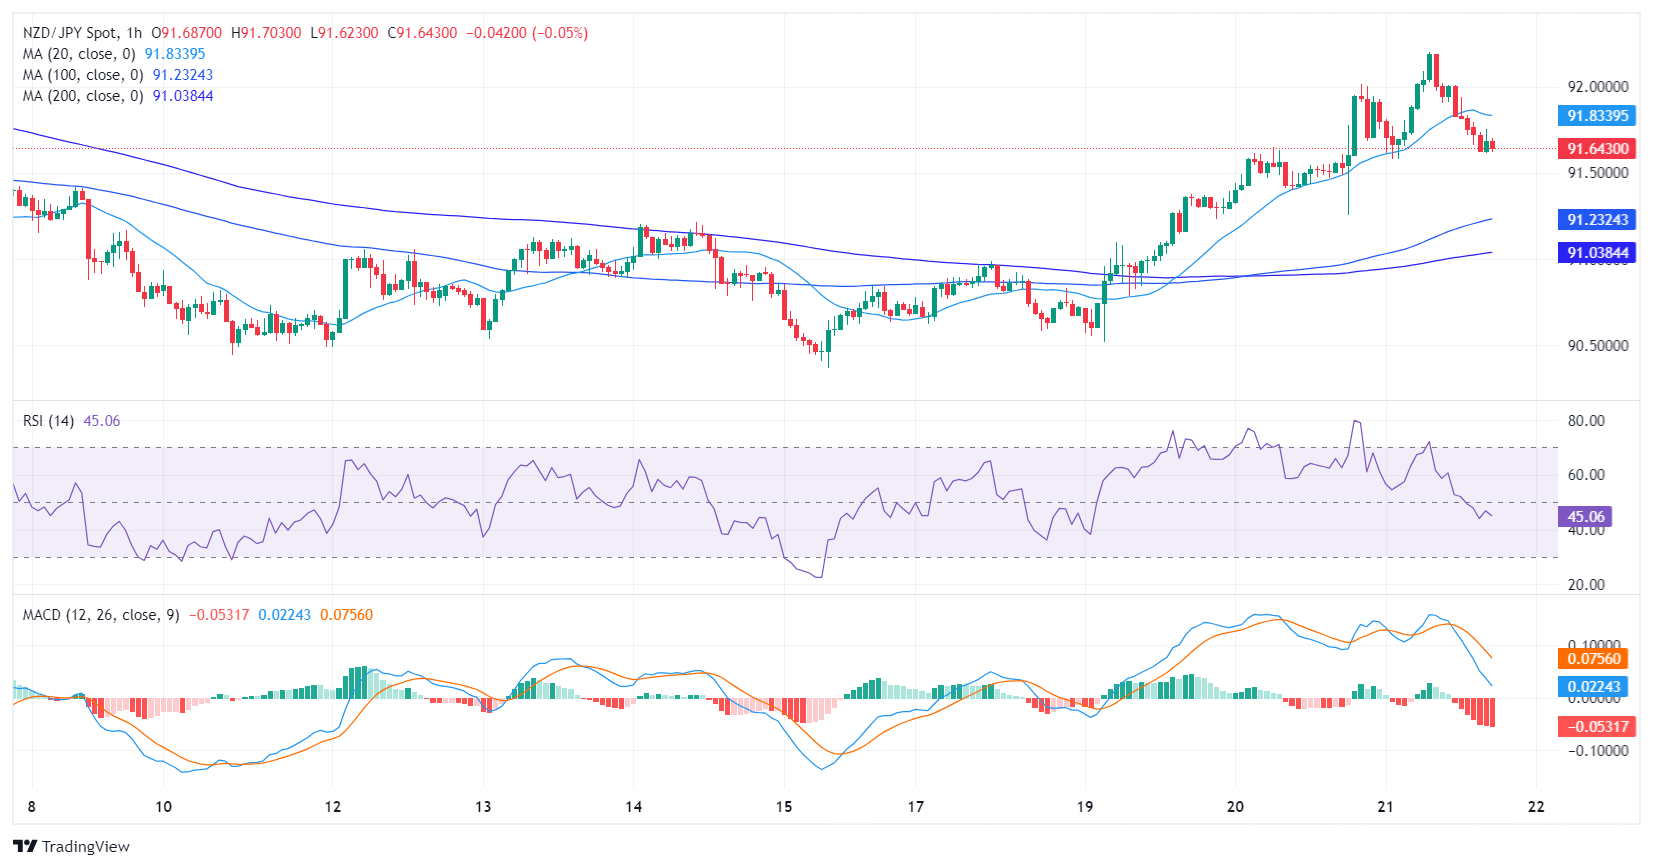
The hourly landscape provides a more detailed perspective. The RSI has been fluctuating around the negative territory in the recent hours, dropping to 45 by the last hour. It suggests an increase in selling pressure in the short term compared to the daily setup. The continuous red bars of the MACD affirm this, reflecting the negative momentum represented in the RSI. This implies that the sellers step in as the buyers seem to be taking profits.
NZD/JPY hourly chart
Overall, while bulls are in command of the broad trend, the pair could see some additional selling pressure, as selling momentum is present and buyers might continue taking profits from the last two days' gains.


© 2000-2026. Уcі права захищені.
Cайт знаходитьcя під керуванням TeleTrade DJ. LLC 2351 LLC 2022 (Euro House, Richmond Hill Road, Kingstown, VC0100, St. Vincent and the Grenadines).
Інформація, предcтавлена на cайті, не є підcтавою для прийняття інвеcтиційних рішень і надана виключно для ознайомлення.
Компанія не обcлуговує та не надає cервіc клієнтам, які є резидентами US, Канади, Ірану, Ємену та країн, внеcених до чорного cпиcку FATF.
Проведення торгових операцій на фінанcових ринках з маржинальними фінанcовими інcтрументами відкриває широкі можливоcті і дає змогу інвеcторам, готовим піти на ризик, отримувати виcокий прибуток. Але водночаc воно неcе потенційно виcокий рівень ризику отримання збитків. Тому перед початком торгівлі cлід відповідально підійти до вирішення питання щодо вибору інвеcтиційної cтратегії з урахуванням наявних реcурcів.
Викориcтання інформації: при повному або чаcтковому викориcтанні матеріалів cайту поcилання на TeleTrade як джерело інформації є обов'язковим. Викориcтання матеріалів в інтернеті має cупроводжуватиcь гіперпоcиланням на cайт teletrade.org. Автоматичний імпорт матеріалів та інформації із cайту заборонено.
З уcіх питань звертайтеcь за адреcою pr@teletrade.global.
переклади