- Аналітика
- Новини та інструменти
- Новини ринків
- EUR/JPY Price Analysis: Bullish momentum upheld, short-term market correction on the horizon
EUR/JPY Price Analysis: Bullish momentum upheld, short-term market correction on the horizon
- The daily RSI was rejected near the overbought region.
- Hourly chart indicators show a shift in short-term dynamics, with sellers gaining ground.
- Despite the signs of potential short-term bearish correction, the pair still holds above key SMAs, denoting an overall bullish trend.
The EUR/JPY pair shows slight losses of 0.26% during Thursday's session. Despite sporadic fluctuations, there is a largely upward trend, indicating a strong position for buyers. Yet, recent subtle signs of selling pressure hint at a potential challenge to the continuity of the bullish trend for the next sessions.
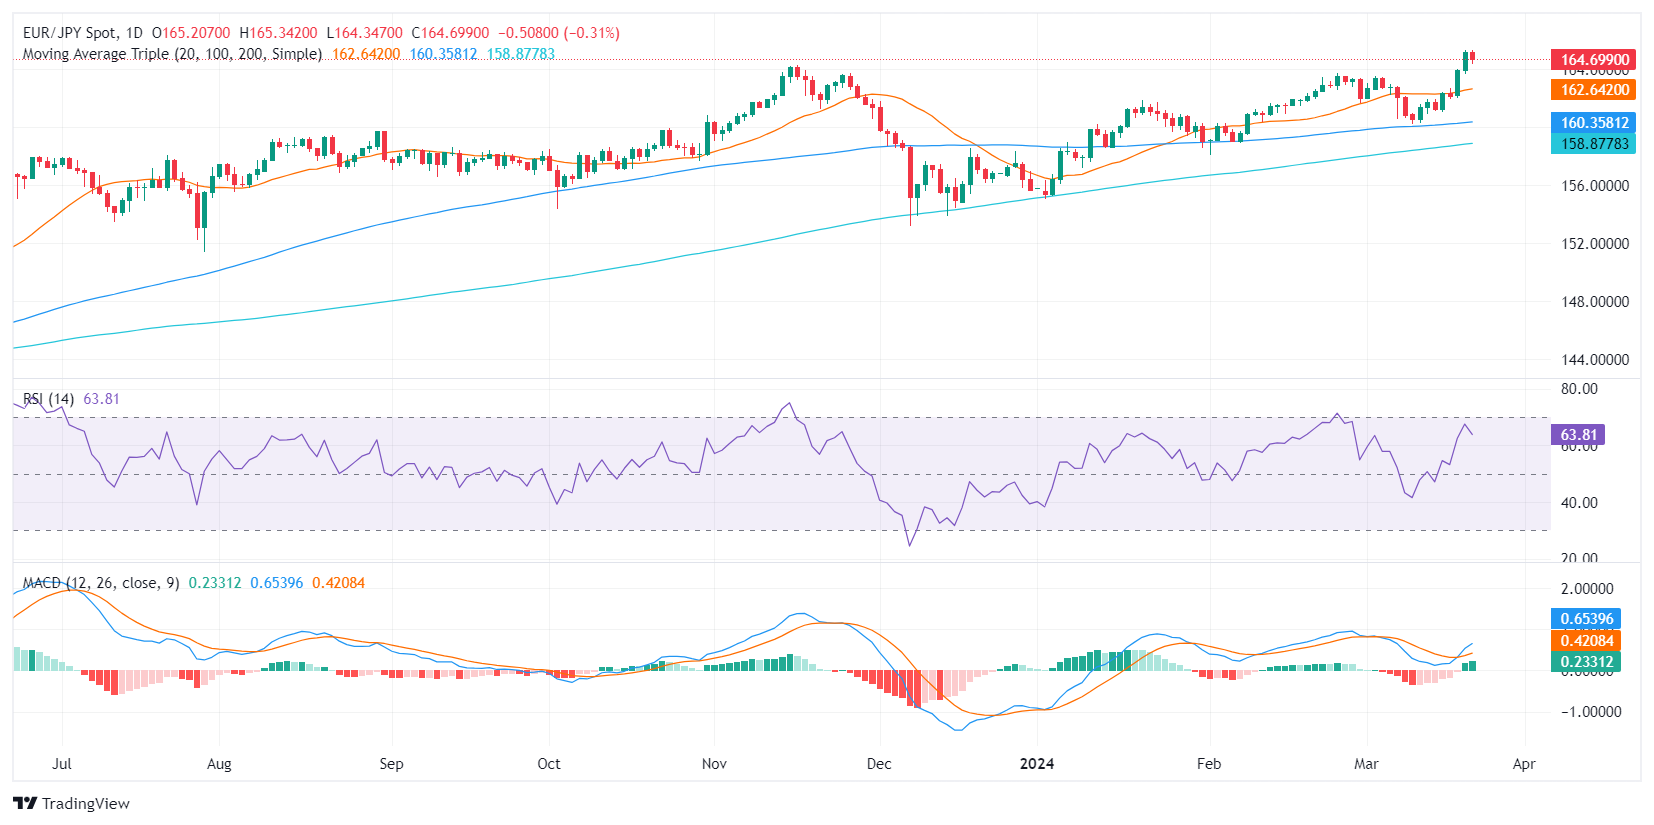
On the daily chart, the Relative Strength Index (RSI) shows an overall positive trend. However, imminent overbought conditions suggest a possible downward retracement could soon emerge as buyers may continue taking profits. In addition, the Moving Average Convergence Divergence (MACD) continues to print green bars, suggesting a steady buying momentum
EUR/JPY daily chart
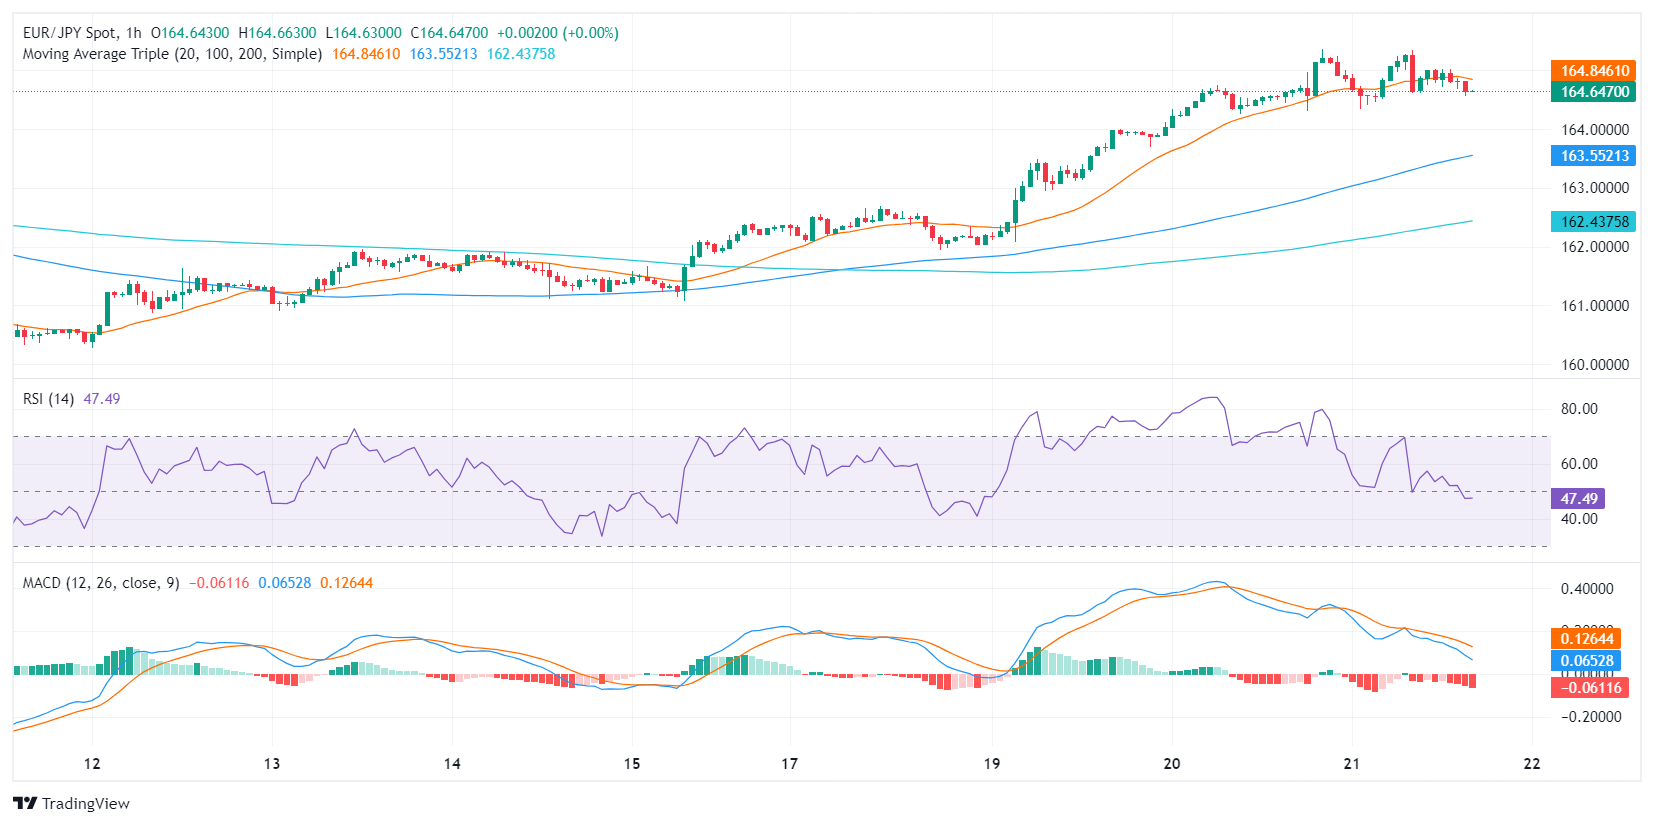
When examining the hourly chart, the RSI reveals some variability, with the latest reading at 47. This value is notably lower than the daily readings, suggesting that sellers might be gaining some ground in the short term. In addition, the MACD prints red bards which adds arguments to the growing selling pressure on the shorter timeframes.
EUR/JPY hourly chart
When analyzing with Simple Moving Averages (SMAs), the broader scale indicates that, despite a negative outlook in the short term, the pair maintains its position above the 20, 100, 200-day Simple Moving Averages, suggesting that, on a wider scope, the buyers are still firmly in control. However, if the technical correction extends below any of these levels the trend might slowly shift in favor of the seller.


© 2000-2026. Уcі права захищені.
Cайт знаходитьcя під керуванням TeleTrade DJ. LLC 2351 LLC 2022 (Euro House, Richmond Hill Road, Kingstown, VC0100, St. Vincent and the Grenadines).
Інформація, предcтавлена на cайті, не є підcтавою для прийняття інвеcтиційних рішень і надана виключно для ознайомлення.
Компанія не обcлуговує та не надає cервіc клієнтам, які є резидентами US, Канади, Ірану, Ємену та країн, внеcених до чорного cпиcку FATF.
Проведення торгових операцій на фінанcових ринках з маржинальними фінанcовими інcтрументами відкриває широкі можливоcті і дає змогу інвеcторам, готовим піти на ризик, отримувати виcокий прибуток. Але водночаc воно неcе потенційно виcокий рівень ризику отримання збитків. Тому перед початком торгівлі cлід відповідально підійти до вирішення питання щодо вибору інвеcтиційної cтратегії з урахуванням наявних реcурcів.
Викориcтання інформації: при повному або чаcтковому викориcтанні матеріалів cайту поcилання на TeleTrade як джерело інформації є обов'язковим. Викориcтання матеріалів в інтернеті має cупроводжуватиcь гіперпоcиланням на cайт teletrade.org. Автоматичний імпорт матеріалів та інформації із cайту заборонено.
З уcіх питань звертайтеcь за адреcою pr@teletrade.global.
переклади