- Аналітика
- Новини та інструменти
- Новини ринків
- NZD/USD Price Analysis: Hovers above the psychological support of 0.6100
NZD/USD Price Analysis: Hovers above the psychological support of 0.6100
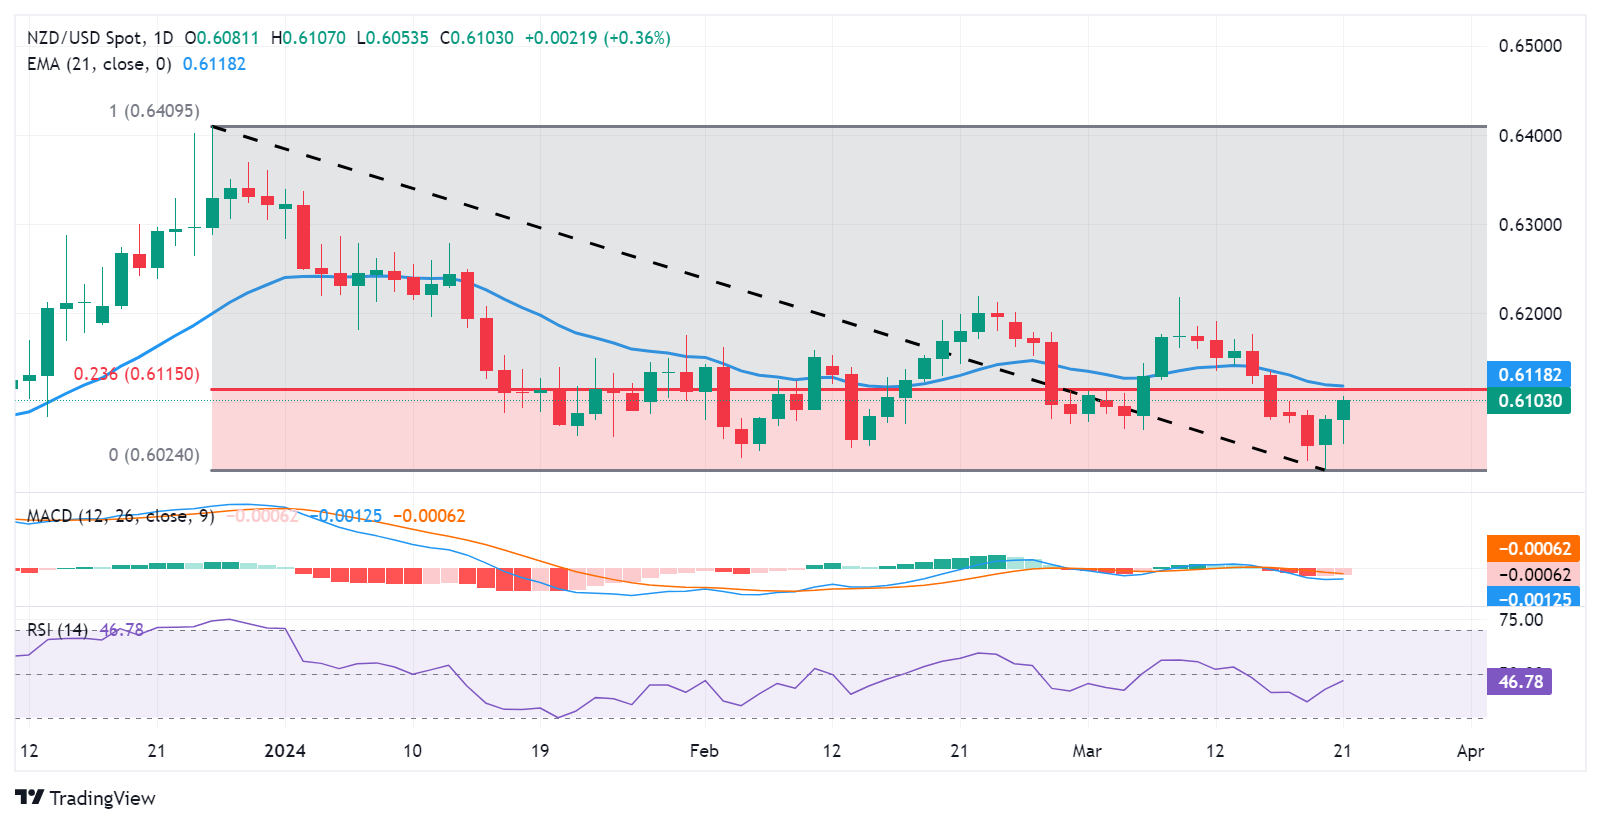
- NZD/USD could test the psychological support of 0.6100 on Thursday.
- Technical analysis indicates a bearish momentum for the pair.
- The area around the 23.6% Fibonacci retracement level and the 21-day EMA could act as a resistance zone.
NZD/USD continues to gain ground for the second consecutive day, which could be attributed to the dovish remarks by the Federal Reserve. The pair trades above the psychological support of 0.6100 during the early European session on Thursday.
A decisive move below this level could exert downward pressure on the NZD/USD pair to navigate the area around the major support of 0.6050.
A break below the latter could lead the NZD/USD pair to revisit March’s low at 0.6024, followed by the psychological support at 0.6000. Traders will closely monitor these levels for potential shifts in market sentiment.
According to the Moving Average Convergence Divergence (MACD) analysis, a prevailing downward sentiment is indicated for the NZD/USD pair. This is evidenced by the MACD line positioned below both the centerline and the signal line, signaling a bearish trend. Furthermore, the 14-day Relative Strength Index (RSI) is below the 50 level, providing additional confirmation of the bearish sentiment.
On the upside, the NZD/USD pair could find a key barrier lies at the 23.6% Fibonacci retracement level at 0.6115, aligned with the 21-day Exponential Moving Average (EMA) at 0.6118. The pair could face further resistance barriers if it climbs higher, with key levels anticipated at 0.6150.
NZD/USD: Daily Chart


© 2000-2026. Уcі права захищені.
Cайт знаходитьcя під керуванням TeleTrade DJ. LLC 2351 LLC 2022 (Euro House, Richmond Hill Road, Kingstown, VC0100, St. Vincent and the Grenadines).
Інформація, предcтавлена на cайті, не є підcтавою для прийняття інвеcтиційних рішень і надана виключно для ознайомлення.
Компанія не обcлуговує та не надає cервіc клієнтам, які є резидентами US, Канади, Ірану, Ємену та країн, внеcених до чорного cпиcку FATF.
Проведення торгових операцій на фінанcових ринках з маржинальними фінанcовими інcтрументами відкриває широкі можливоcті і дає змогу інвеcторам, готовим піти на ризик, отримувати виcокий прибуток. Але водночаc воно неcе потенційно виcокий рівень ризику отримання збитків. Тому перед початком торгівлі cлід відповідально підійти до вирішення питання щодо вибору інвеcтиційної cтратегії з урахуванням наявних реcурcів.
Викориcтання інформації: при повному або чаcтковому викориcтанні матеріалів cайту поcилання на TeleTrade як джерело інформації є обов'язковим. Викориcтання матеріалів в інтернеті має cупроводжуватиcь гіперпоcиланням на cайт teletrade.org. Автоматичний імпорт матеріалів та інформації із cайту заборонено.
З уcіх питань звертайтеcь за адреcою pr@teletrade.global.
переклади