- Аналітика
- Новини та інструменти
- Новини ринків
- NZD/JPY Price Analysis: Bulls are firmly in control according to daily trends, houly indicators consolidate
NZD/JPY Price Analysis: Bulls are firmly in control according to daily trends, houly indicators consolidate
- The daily chart reveals bullish sentiment, with RSI on an upward trajectory out of the negative zone and MACD depicting decreasing red bars.
- Indicators are consolidating overbought conditions on the hourly chart.
- Bulls must recover the 20-day SMA to confirm a recovery.
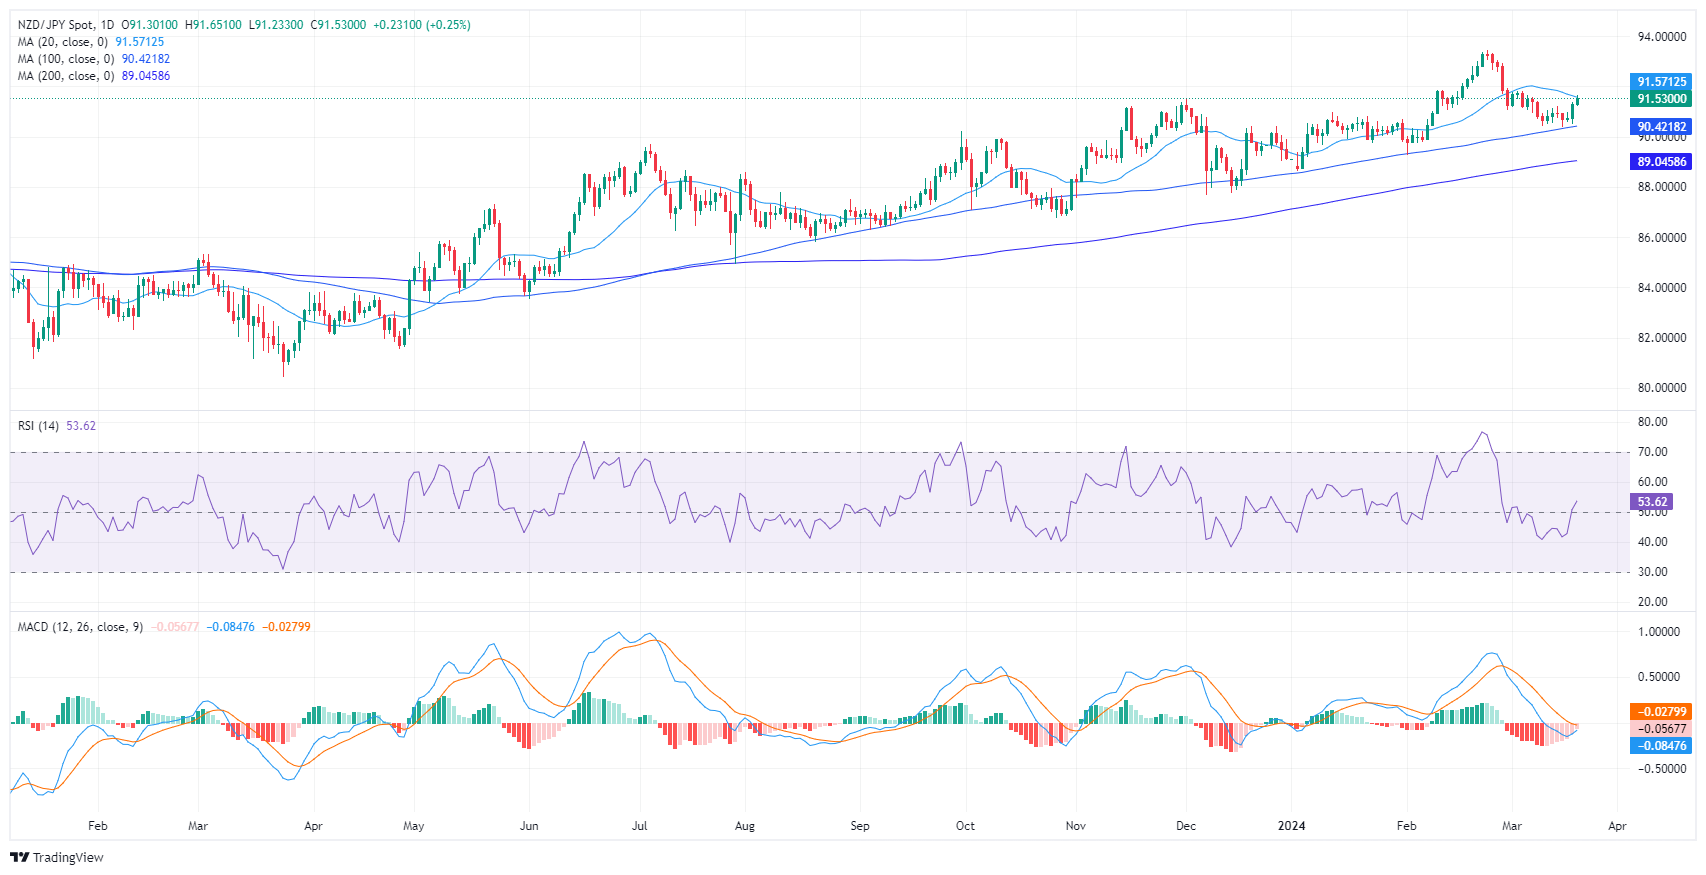
The NZD/JPY currency pair is trading at 91.54, showing gains in Wednesday's session. The broader technical landscape suggests the buyers. Despite recent bearish activity pushing the pair below the 20-day Simple Moving Averages (SMAs), the pair remains aloft of the 100 and 200-day SMAs, indicating an enduring bullish control.
On the daily chart, the NZD/JPY pair exhibits relatively bullish momentum. The Relative Strength Index (RSI) indicates a positive trend with an upward slope, moving above the negative territory. This, combined with the decreasing red bars from the Moving Average Convergence Divergence (MACD) which indicates declining negative momentum, suggests the buyers are gaining the upper hand over sellers.
NZD/JPY Daily Chart
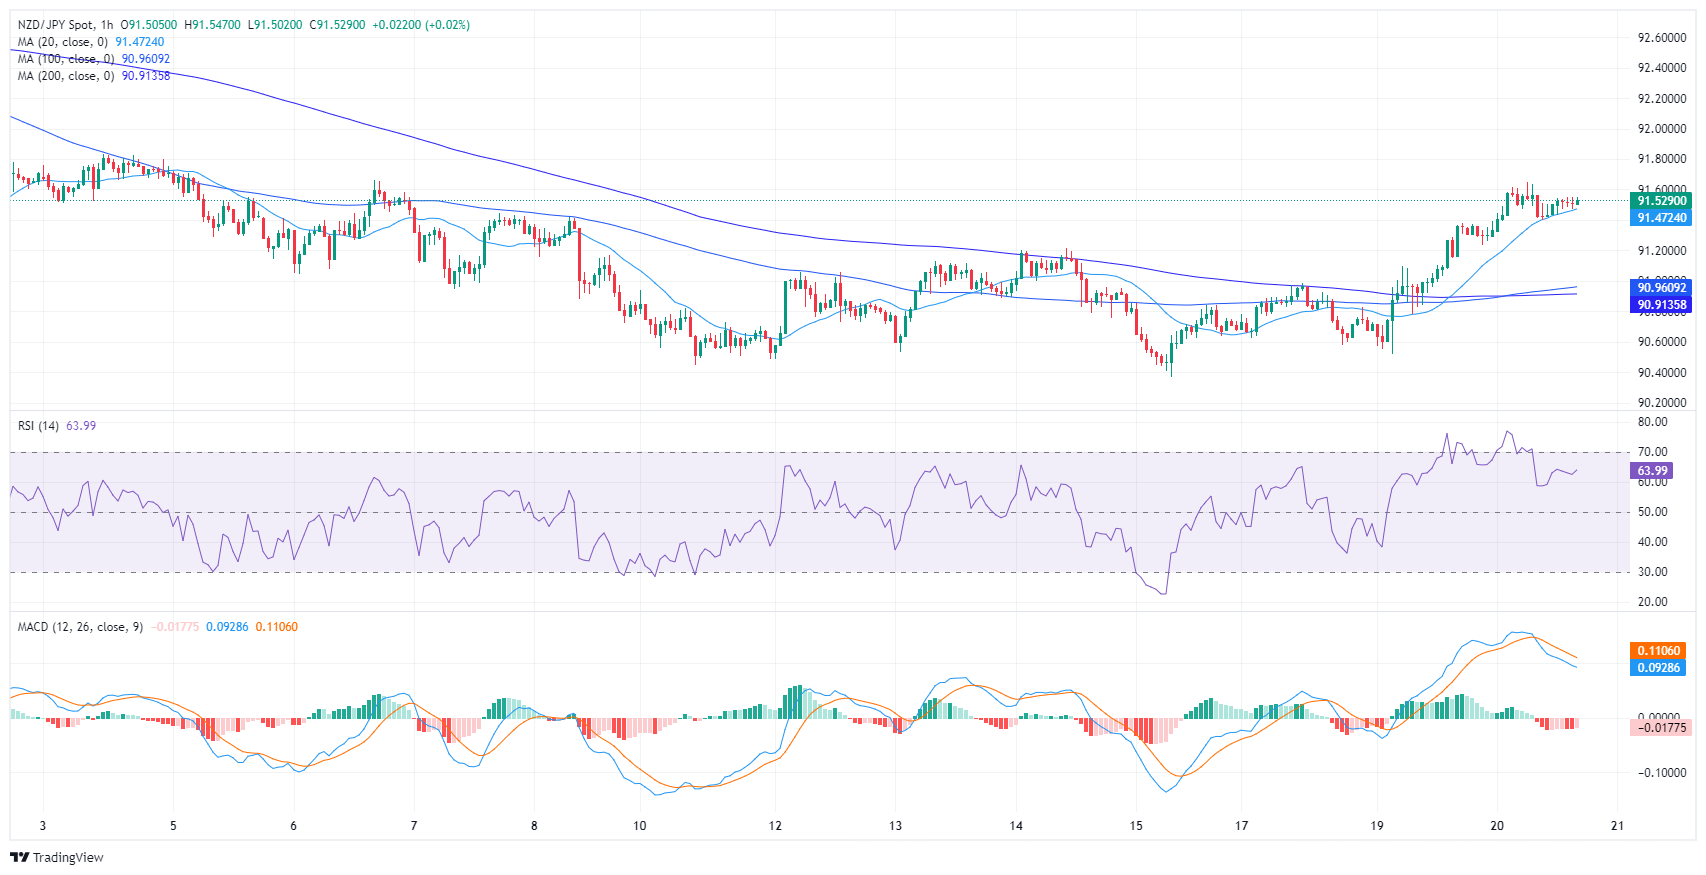
Transitioning to the hourly chart for the NZD/JPY presents a slightly different scenario. Here, the RSI consistently indicates positive with minor fluctuations, hinting at strong buying momentum but consolidating after entering in the overbought area during the European session. Meanwhile, the MACD reveals flat red bars, signifying stagnant negative momentum suggesting that the buyers are gearing up for the next upward leg.
NZD/JPY Hourly Chart


© 2000-2026. Уcі права захищені.
Cайт знаходитьcя під керуванням TeleTrade DJ. LLC 2351 LLC 2022 (Euro House, Richmond Hill Road, Kingstown, VC0100, St. Vincent and the Grenadines).
Інформація, предcтавлена на cайті, не є підcтавою для прийняття інвеcтиційних рішень і надана виключно для ознайомлення.
Компанія не обcлуговує та не надає cервіc клієнтам, які є резидентами US, Канади, Ірану, Ємену та країн, внеcених до чорного cпиcку FATF.
Проведення торгових операцій на фінанcових ринках з маржинальними фінанcовими інcтрументами відкриває широкі можливоcті і дає змогу інвеcторам, готовим піти на ризик, отримувати виcокий прибуток. Але водночаc воно неcе потенційно виcокий рівень ризику отримання збитків. Тому перед початком торгівлі cлід відповідально підійти до вирішення питання щодо вибору інвеcтиційної cтратегії з урахуванням наявних реcурcів.
Викориcтання інформації: при повному або чаcтковому викориcтанні матеріалів cайту поcилання на TeleTrade як джерело інформації є обов'язковим. Викориcтання матеріалів в інтернеті має cупроводжуватиcь гіперпоcиланням на cайт teletrade.org. Автоматичний імпорт матеріалів та інформації із cайту заборонено.
З уcіх питань звертайтеcь за адреcою pr@teletrade.global.
переклади