- Аналітика
- Новини та інструменти
- Новини ринків
- GBP/USD Price Analysis: Clings near 1.2720 followed by the barrier at 14-day EMA
GBP/USD Price Analysis: Clings near 1.2720 followed by the barrier at 14-day EMA
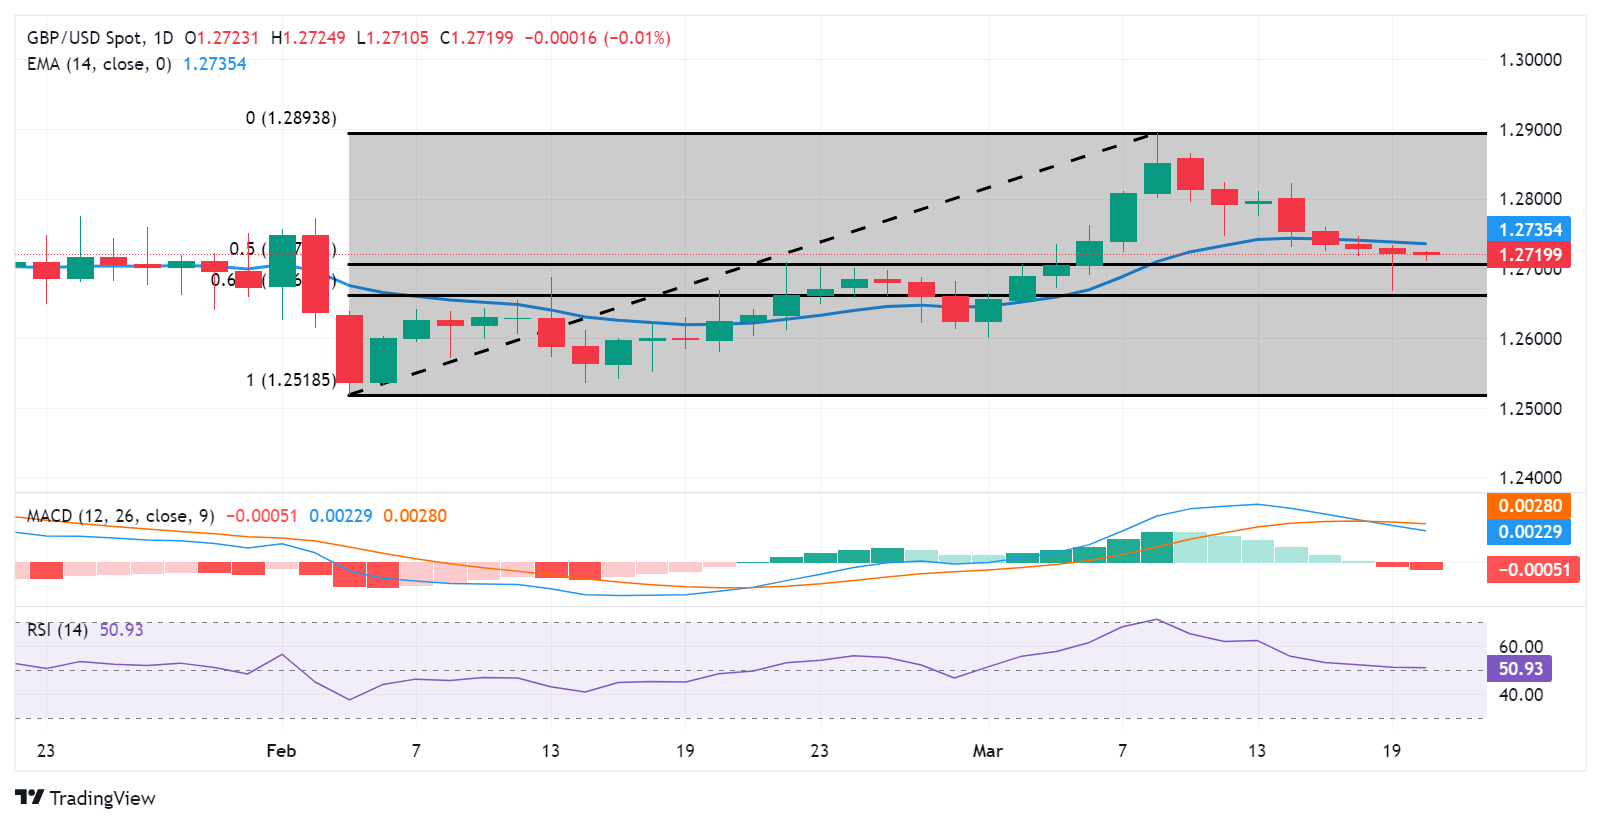
- GBP/USD pair could target immediate support around the 50.0% retracement level of 1.2706.
- MACD, the lagging indicator, suggests a tepid momentum for the pair.
- The key barrier could be found at the 14-day EMA of 1.2735 level and major resistance of 1.2750 level.
GBP/USD trims intraday losses and attempts to snap its losing streak on Wednesday. The GBP/USD pair hovers near 1.2720 during the Asian trading hours. The market adopts cautious sentiment ahead of the Federal Reserve’s (Fed) interest rate decision later in the North American session.
The GBP/USD pair finds immediate support at the 50.0% retracement level of 1.2706, in conjunction with the psychological level of 1.2700. A break below this level could put downward pressure on the pair to navigate the region around the 61.8% Fibonacci retracement level of 1.2661, followed by the major support of 1.2650 level.
The technical analysis of the GBP/USD pair shows that the 14-day Relative Strength Index (RSI) is positioned above 50. This indicates a bullish momentum for the pair. However, the Moving Average Convergence Divergence (MACD), a lagging indicator, suggests a tepid momentum for the pair. the MACD line is situated above the centerline but shows divergence below the signal line.
On the upside, the GBP/USD pair could meet the key barrier at the 14-day Exponential Moving Average (EMA) of 1.2735 level followed by the major resistance of 1.2750 level. A break above the latter could exert upward support for the pair to explore the area around the psychological level at 1.2800.
GBP/USD: Daily Chart


© 2000-2026. Уcі права захищені.
Cайт знаходитьcя під керуванням TeleTrade DJ. LLC 2351 LLC 2022 (Euro House, Richmond Hill Road, Kingstown, VC0100, St. Vincent and the Grenadines).
Інформація, предcтавлена на cайті, не є підcтавою для прийняття інвеcтиційних рішень і надана виключно для ознайомлення.
Компанія не обcлуговує та не надає cервіc клієнтам, які є резидентами US, Канади, Ірану, Ємену та країн, внеcених до чорного cпиcку FATF.
Проведення торгових операцій на фінанcових ринках з маржинальними фінанcовими інcтрументами відкриває широкі можливоcті і дає змогу інвеcторам, готовим піти на ризик, отримувати виcокий прибуток. Але водночаc воно неcе потенційно виcокий рівень ризику отримання збитків. Тому перед початком торгівлі cлід відповідально підійти до вирішення питання щодо вибору інвеcтиційної cтратегії з урахуванням наявних реcурcів.
Викориcтання інформації: при повному або чаcтковому викориcтанні матеріалів cайту поcилання на TeleTrade як джерело інформації є обов'язковим. Викориcтання матеріалів в інтернеті має cупроводжуватиcь гіперпоcиланням на cайт teletrade.org. Автоматичний імпорт матеріалів та інформації із cайту заборонено.
З уcіх питань звертайтеcь за адреcою pr@teletrade.global.
переклади