- Аналітика
- Новини та інструменти
- Новини ринків
- NZD/USD Price Analysis: Bears remain in control, yet the hourly chart hints at easing sell-off pressure
NZD/USD Price Analysis: Bears remain in control, yet the hourly chart hints at easing sell-off pressure
- The daily chart of NZD/USD presents a bearish outlook with the RSI and MACD deep in the red zone.
- On the hourly chart, the selling pressure is easing.
- The NZD/USD is operating below the main SMAs, indicating a persisting bearish bias.
The NZD/USD pair registered a decline of 0.54%, falling towards 0.6050 in Tuesday's session. Earlier in the session, indicators reached oversold conditions on the hourly chart, and ahead of the Asian session, the pair seems to be consolidating
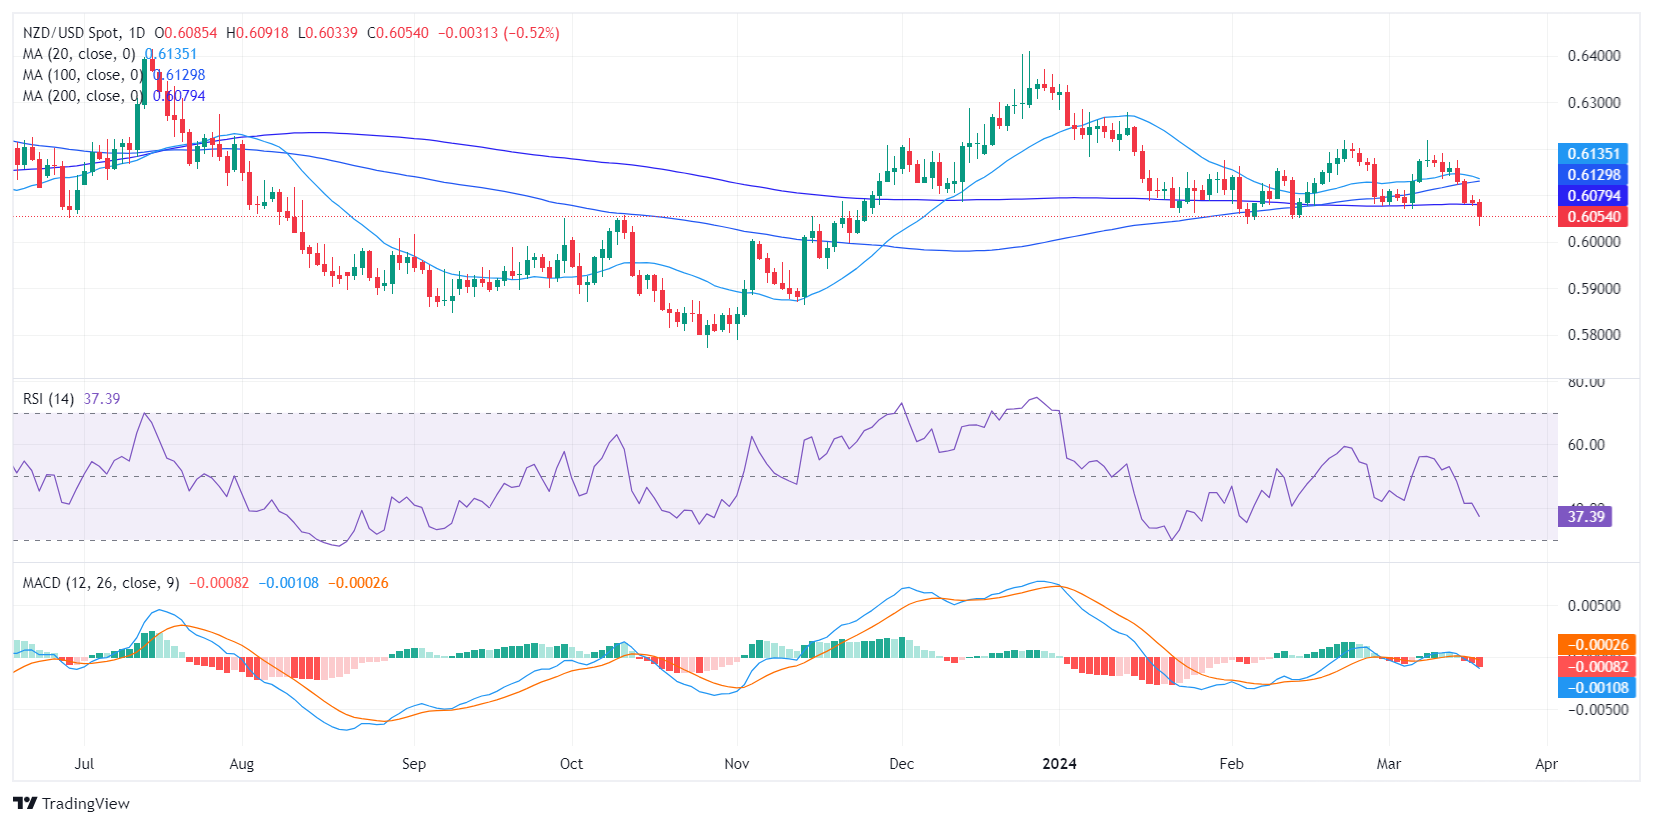
On the daily chart, the pair is facing intense selling pressure, as indicated by the declining Relative Strength Index (RSI). The latest reading stands at 36, situated in the negative territory and nearing the oversold threshold, suggesting that sellers currently dominate the market. The Moving Average Convergence Divergence (MACD) also confirms this bearish sentiment, with its rising red bars indicating mounting negative momentum.
NZD/USD daily chart
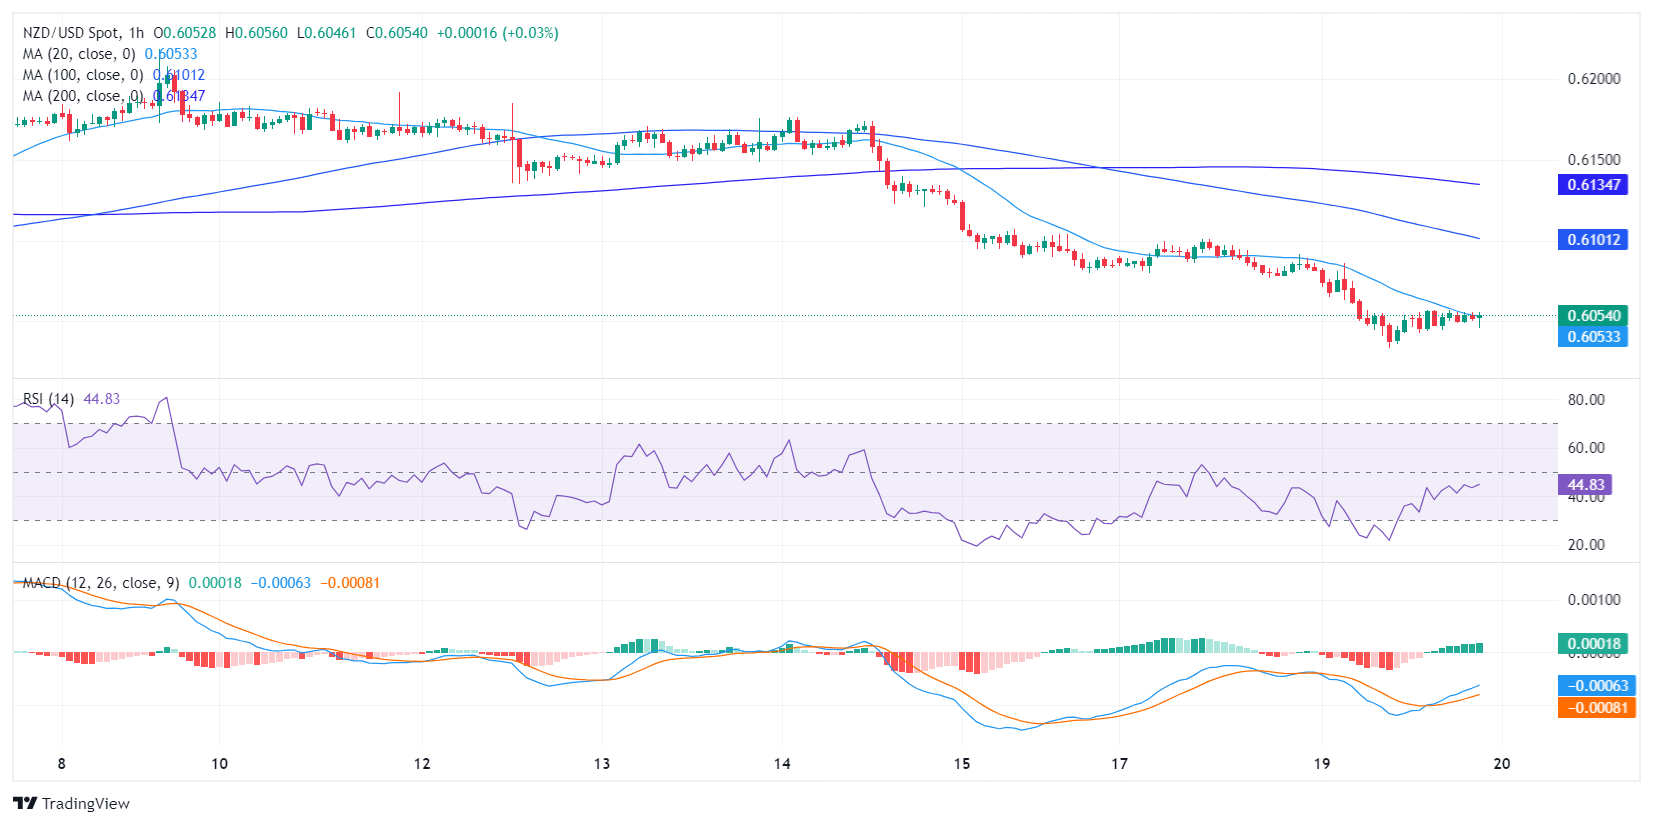
On the hourly chart, however, the picture differs. The RSI readings appear to fluctuate within the negative territory, with the last reading measured at 42, slightly higher than the reading on the daily chart, denoting tempered selling pressure after bottoming at a low of 22 earlier in the session. Here, the MACD shows a declining selling pressure.
NZD/USD hourly chart
On a broader scale, the trend is still bearish as the pair continues to trade below its 20, 100, and 200-day Simple Moving Averages (SMAs).


© 2000-2026. Уcі права захищені.
Cайт знаходитьcя під керуванням TeleTrade DJ. LLC 2351 LLC 2022 (Euro House, Richmond Hill Road, Kingstown, VC0100, St. Vincent and the Grenadines).
Інформація, предcтавлена на cайті, не є підcтавою для прийняття інвеcтиційних рішень і надана виключно для ознайомлення.
Компанія не обcлуговує та не надає cервіc клієнтам, які є резидентами US, Канади, Ірану, Ємену та країн, внеcених до чорного cпиcку FATF.
Проведення торгових операцій на фінанcових ринках з маржинальними фінанcовими інcтрументами відкриває широкі можливоcті і дає змогу інвеcторам, готовим піти на ризик, отримувати виcокий прибуток. Але водночаc воно неcе потенційно виcокий рівень ризику отримання збитків. Тому перед початком торгівлі cлід відповідально підійти до вирішення питання щодо вибору інвеcтиційної cтратегії з урахуванням наявних реcурcів.
Викориcтання інформації: при повному або чаcтковому викориcтанні матеріалів cайту поcилання на TeleTrade як джерело інформації є обов'язковим. Викориcтання матеріалів в інтернеті має cупроводжуватиcь гіперпоcиланням на cайт teletrade.org. Автоматичний імпорт матеріалів та інформації із cайту заборонено.
З уcіх питань звертайтеcь за адреcою pr@teletrade.global.
переклади