- Аналітика
- Новини та інструменти
- Новини ринків
- EUR/JPY Price Analysis: Buyers maintain stronghold, impending overbought conditions signal possible downturn
EUR/JPY Price Analysis: Buyers maintain stronghold, impending overbought conditions signal possible downturn
- The EUR/JPY rallied in Tuesday’s session, seeing more than 1% gains.
- The daily RSI reveals growing buying momentum, deep in positive territory.
- The hourly chart hints at overbought conditions, and the RSI staying above 70 signals the potential for profit-taking sell-offs.
In Tuesday's session, the EUR/JPY pair is trading around the 164.00 region, marking a strong rally of 1.14%. The daily outlook is tilting in favor of the buyers while overbought conditions seen on the hourly chart suggest that consolidation is on the horizon.
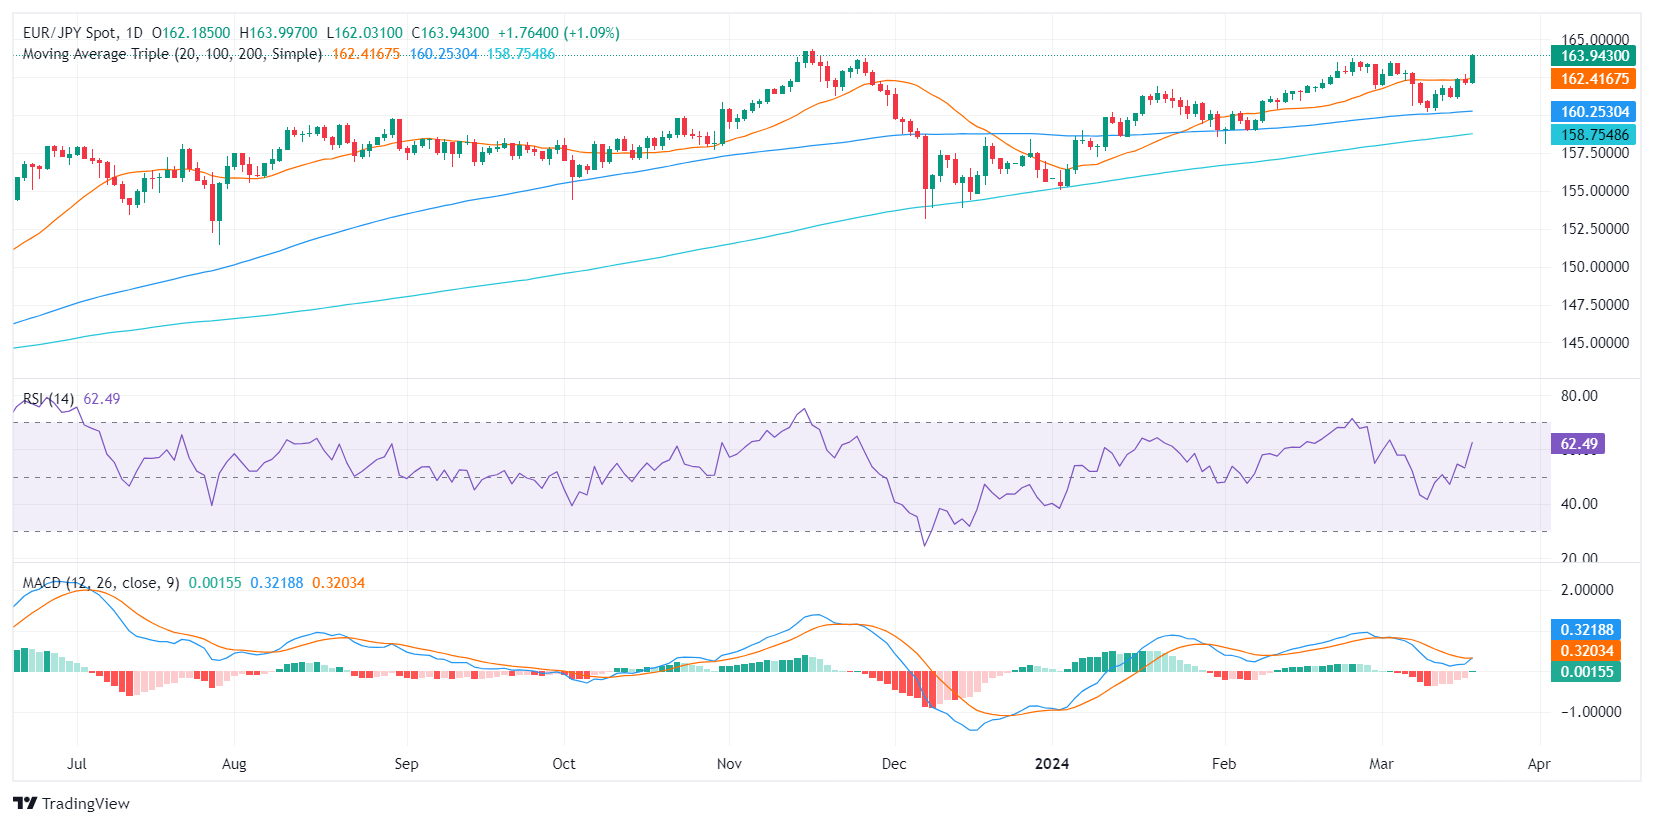
On the daily chart, the pair exhibits increasing momentum, as indicated by the latest Relative Strength Index (RSI) values. Moving from negative territory, the recent RSI trajectory consolidated in positive territory, lately peaking at 65 which is approaching overbought status. Currently, buyers dominate the market, leading to the possibility of the pair moving into overbought conditions soon.
EUR/JPY daily chart
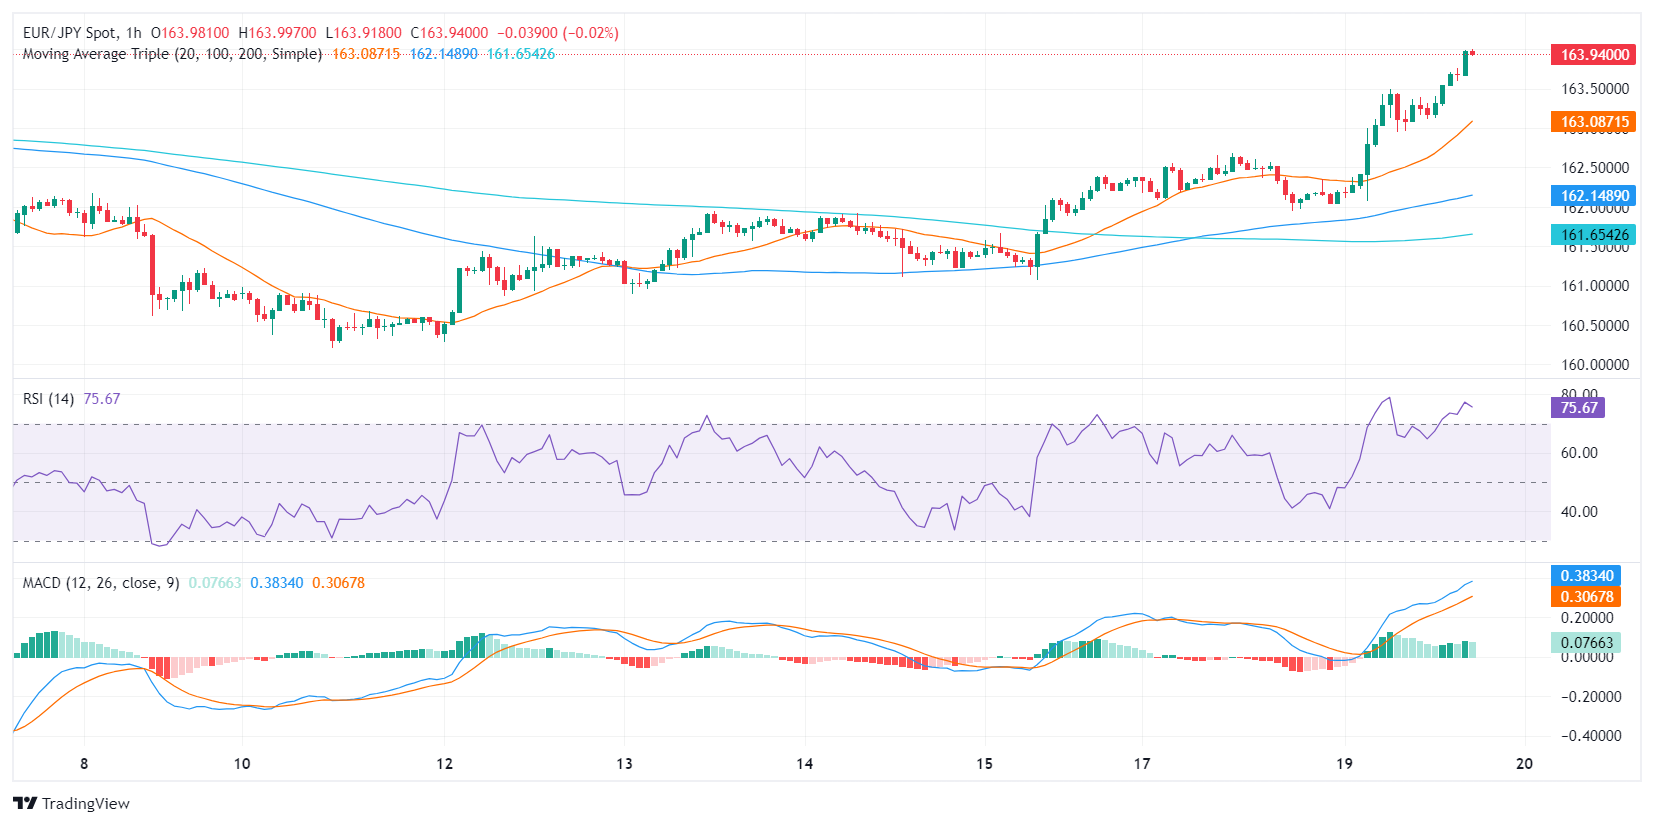
When examining the hourly chart, the EUR/JPY pair displays persistent overbought conditions. The RSI values consistently stay strong and above 70 which suggests intense buying pressure. The Moving Average Convergence Divergence (MACD) reinforces this bullish momentum with its rising green bars. However, these overbought conditions might soon provoke a downward correction as overbuying could lead to profit-taking sell-offs.
EUR/JPY hourly chart
Conclusively, both the daily and hourly charts indicate robust buying momentum. The positive outlook is further corroborated by the pair trading above the main Simple Moving Averages (SMAs) of 20, 100, and 200 days. Any downward correction which keeps the pair above these levels, won’t affect the overall bullish trend.


© 2000-2026. Уcі права захищені.
Cайт знаходитьcя під керуванням TeleTrade DJ. LLC 2351 LLC 2022 (Euro House, Richmond Hill Road, Kingstown, VC0100, St. Vincent and the Grenadines).
Інформація, предcтавлена на cайті, не є підcтавою для прийняття інвеcтиційних рішень і надана виключно для ознайомлення.
Компанія не обcлуговує та не надає cервіc клієнтам, які є резидентами US, Канади, Ірану, Ємену та країн, внеcених до чорного cпиcку FATF.
Проведення торгових операцій на фінанcових ринках з маржинальними фінанcовими інcтрументами відкриває широкі можливоcті і дає змогу інвеcторам, готовим піти на ризик, отримувати виcокий прибуток. Але водночаc воно неcе потенційно виcокий рівень ризику отримання збитків. Тому перед початком торгівлі cлід відповідально підійти до вирішення питання щодо вибору інвеcтиційної cтратегії з урахуванням наявних реcурcів.
Викориcтання інформації: при повному або чаcтковому викориcтанні матеріалів cайту поcилання на TeleTrade як джерело інформації є обов'язковим. Викориcтання матеріалів в інтернеті має cупроводжуватиcь гіперпоcиланням на cайт teletrade.org. Автоматичний імпорт матеріалів та інформації із cайту заборонено.
З уcіх питань звертайтеcь за адреcою pr@teletrade.global.
переклади