- Аналітика
- Новини та інструменти
- Новини ринків
- NZD/USD Price Analysis: Bearish pressures dominate, bulls may seek relief in potential correction
NZD/USD Price Analysis: Bearish pressures dominate, bulls may seek relief in potential correction
- The daily RSI shows a rise in selling traction, supported by the MACD depicting growing red bars.
- The hourly RSI indicates oversold conditions, signaling a potential pullback or bullish correction in the short term.
- Despite daily bearish tendencies, the pair still holds the 200-day SMA.
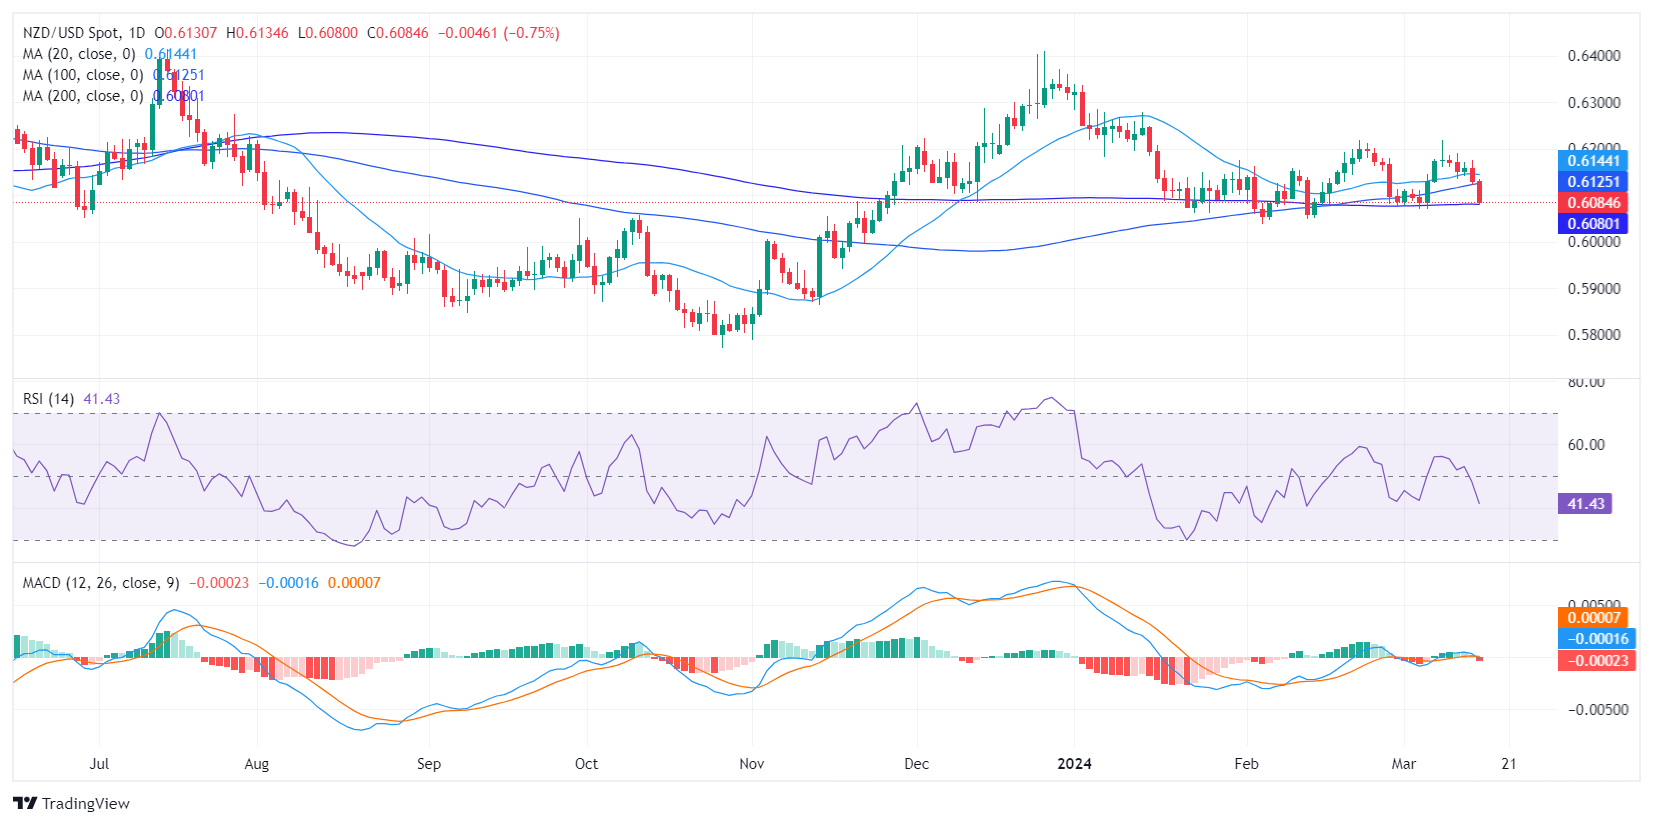
The NZD/USD pair declined to 0.6086, with a significant 0.77% downturn in Friday's session. The market sentiment leans heavily toward the sellers, however, there is a faint glimmer of hope for the buyers, as they still hold on to the 200-day Simple Moving Average (SMA).
On the daily chart, the Relative Strength Index (RSI) has fallen into negative territory, after recovering above 50 last week, which suggests increasing selling pressure. Moreover, the Moving Average Convergence Divergence (MACD) histogram features rising red bars which further indicate growing bearish sentiment in the market.
NZD/USD daily chart
Moving to the hourly chart, there is a stark contrast. The RSI values are in deep, oversold territories, indicating the recent selling pressure may be overextended. This often foretells a possible price pullback or bullish correction in the near term. Regarding the MACD histogram, the green bars suggest neutral momentum, even though they are flat, indicating no significant change in the shorter term but may also hint that the bulls are gearing up.
NZD/USD hourly chart
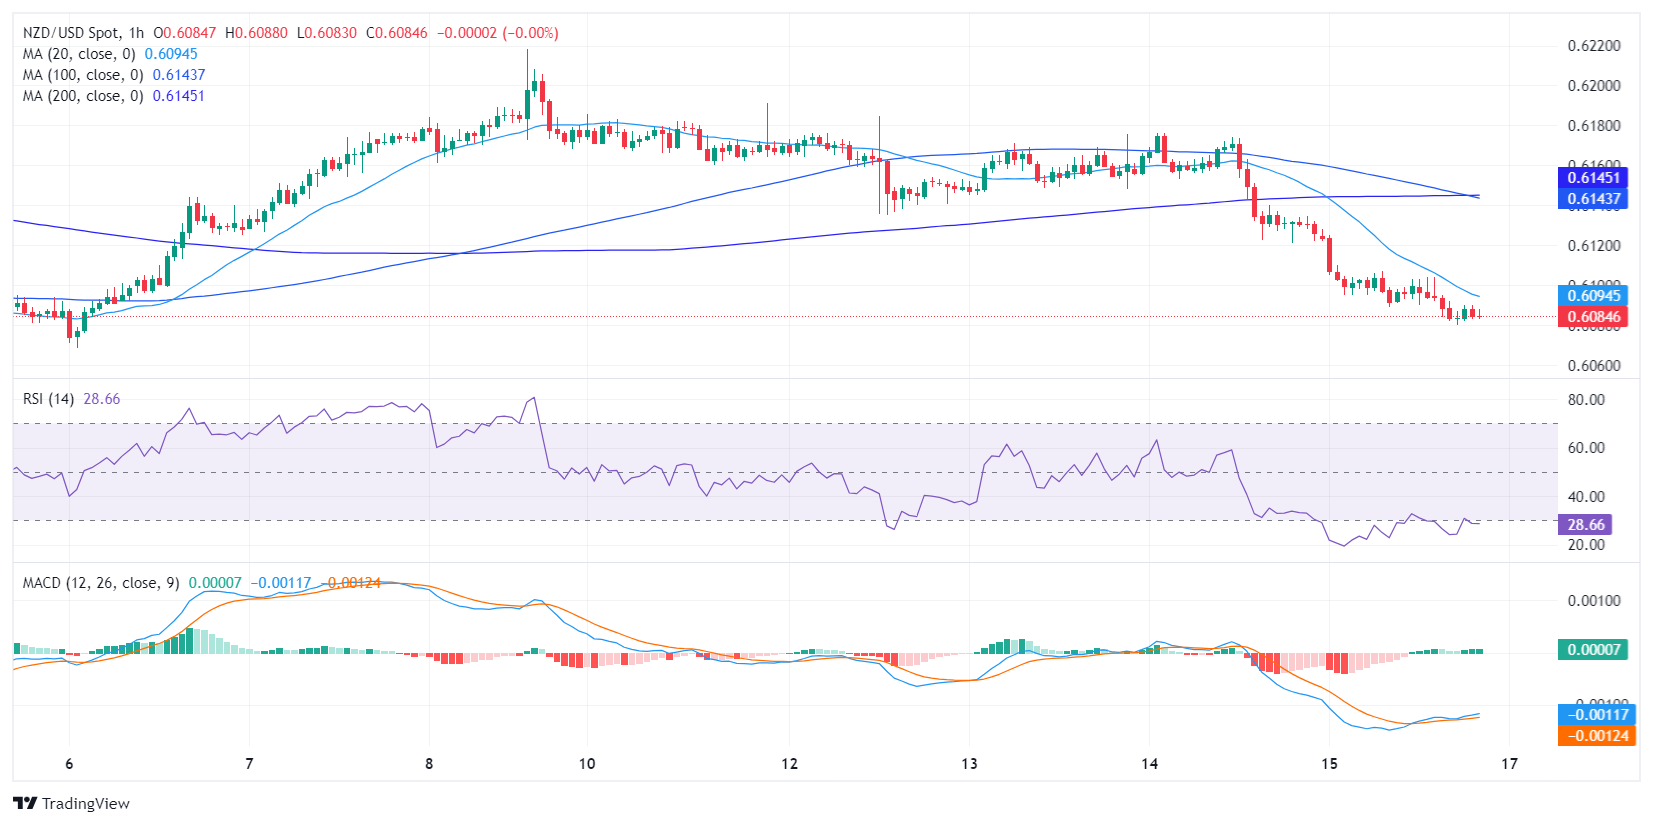
Taking both into account, while the daily chart may hint at a generalized negative posture, the hourly chart suggests the possibility of a reprieve for the bulls very soon. The fact that the NZD/USD pair is holding above the 200-day SMA also lends some weight to this counter-trend, bullish outlook.


© 2000-2026. Уcі права захищені.
Cайт знаходитьcя під керуванням TeleTrade DJ. LLC 2351 LLC 2022 (Euro House, Richmond Hill Road, Kingstown, VC0100, St. Vincent and the Grenadines).
Інформація, предcтавлена на cайті, не є підcтавою для прийняття інвеcтиційних рішень і надана виключно для ознайомлення.
Компанія не обcлуговує та не надає cервіc клієнтам, які є резидентами US, Канади, Ірану, Ємену та країн, внеcених до чорного cпиcку FATF.
Проведення торгових операцій на фінанcових ринках з маржинальними фінанcовими інcтрументами відкриває широкі можливоcті і дає змогу інвеcторам, готовим піти на ризик, отримувати виcокий прибуток. Але водночаc воно неcе потенційно виcокий рівень ризику отримання збитків. Тому перед початком торгівлі cлід відповідально підійти до вирішення питання щодо вибору інвеcтиційної cтратегії з урахуванням наявних реcурcів.
Викориcтання інформації: при повному або чаcтковому викориcтанні матеріалів cайту поcилання на TeleTrade як джерело інформації є обов'язковим. Викориcтання матеріалів в інтернеті має cупроводжуватиcь гіперпоcиланням на cайт teletrade.org. Автоматичний імпорт матеріалів та інформації із cайту заборонено.
З уcіх питань звертайтеcь за адреcою pr@teletrade.global.
переклади