- Аналітика
- Новини та інструменти
- Новини ринків
- NZD/JPY Price Analysis: Bears maintain control, despite recent bullish resurgence
NZD/JPY Price Analysis: Bears maintain control, despite recent bullish resurgence
- On the daily chart, sellers remain in control despite the improvement of the RSI and MACD.
- While the daily chart emits bearish signals, the hourly indicators provide a more balanced picture, showcasing an equilibrium between buyers and sellers.
- The cross saw a recovery during the American session and managed to clear daily losses.
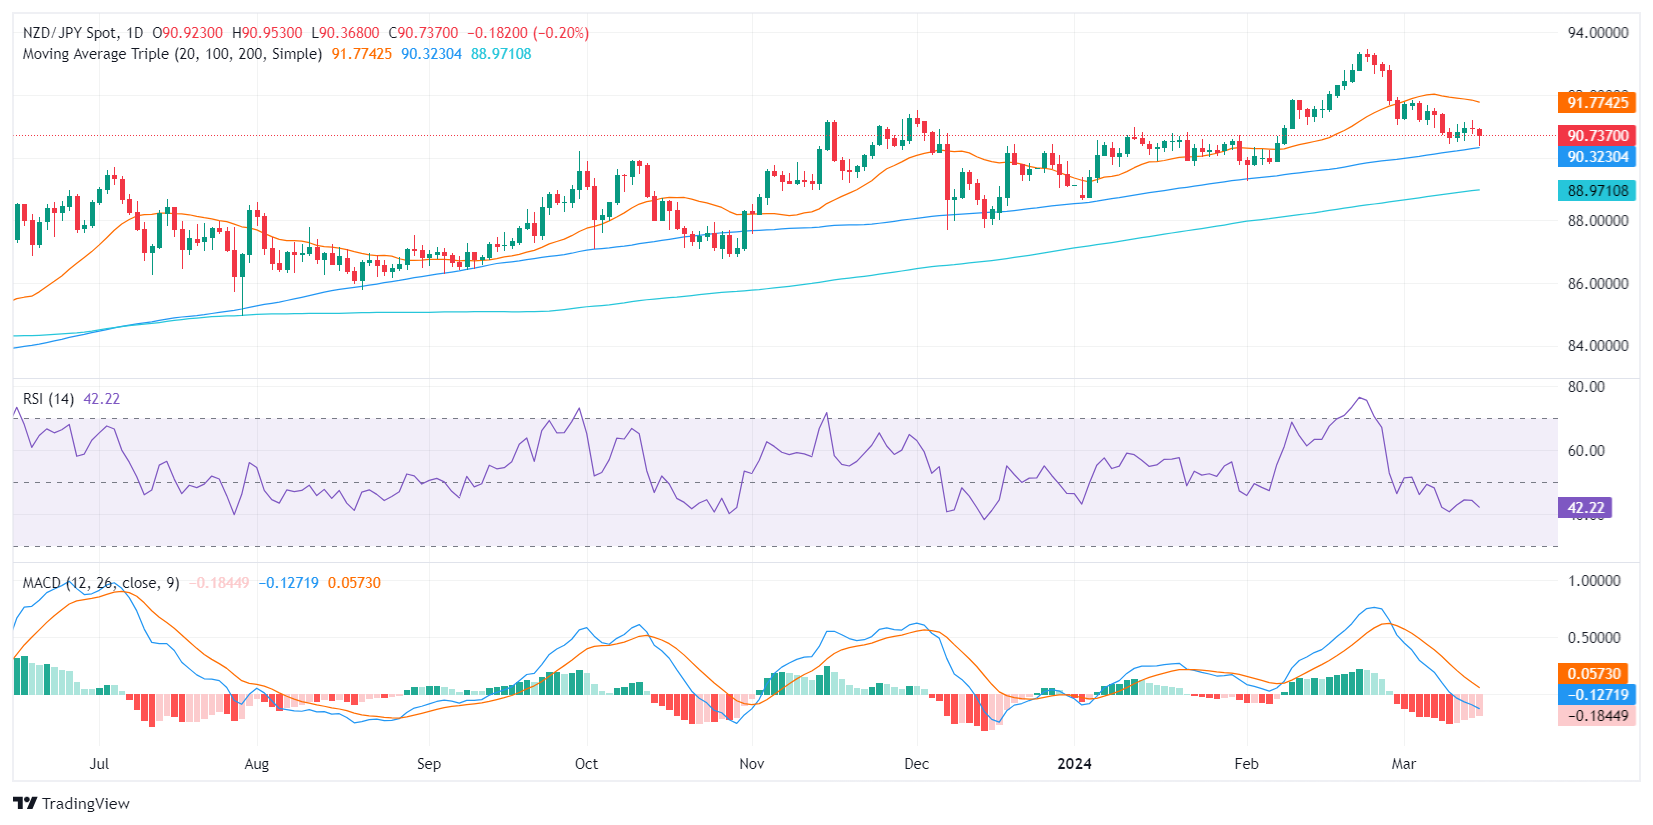
In Friday's session, the NZD/JPY is trading at 90.70, recording a slight loss of 0.22% after bottoming at a low of 90.35. The positioning of the pair above the key 100 and 200-day Simple Moving Averages (SMAs) might hint at bullish prospects in the overall trend, yet the shorter technical outlook tilts toward the bears as it trades below the 20-day average.
On the daily chart, the NZD/JPY's Relative Strength Index (RSI) has been in negative territory, signaling that sellers have been dominant. The Moving Average Convergence Divergence (MACD) doesn't present any brighter picture either. Its histogram has flat red bars, indicating negative momentum and a lack of buying strength.
NZD/JPY daily chart
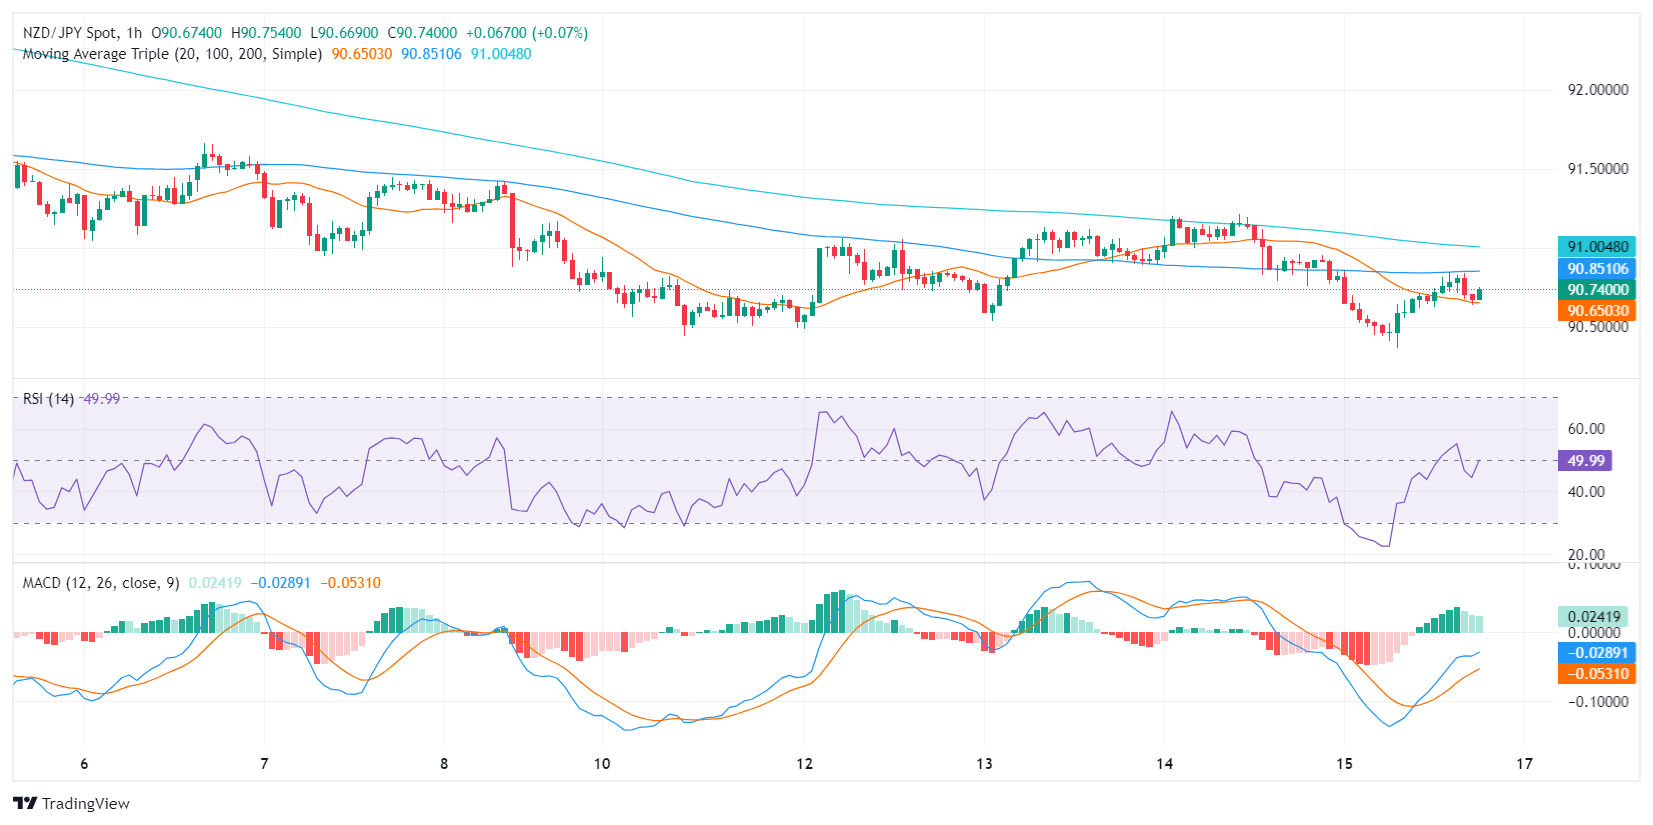
Switching to the hourly chart, the RSI recovered towards 50, the neutral level, suggesting a balance between buyers and sellers. On the other hand, the MACD histogram displays flat green bars, indicating a steady positive momentum.
NZD/JPY hourly chart
To conclude, the broader daily analysis paints a reasonably bearish picture, with the RSI and MACD indicating seller dominance and the pair below the 20-day SMA. Yet, the hourly chart presents a somewhat mixed picture, showing a balance between buyers and sellers. Considering the pair's position above the 100 and 200-day SMAs, despite the immediate bearish sentiment, the bulls might still have a chance to regain control.


© 2000-2026. Уcі права захищені.
Cайт знаходитьcя під керуванням TeleTrade DJ. LLC 2351 LLC 2022 (Euro House, Richmond Hill Road, Kingstown, VC0100, St. Vincent and the Grenadines).
Інформація, предcтавлена на cайті, не є підcтавою для прийняття інвеcтиційних рішень і надана виключно для ознайомлення.
Компанія не обcлуговує та не надає cервіc клієнтам, які є резидентами US, Канади, Ірану, Ємену та країн, внеcених до чорного cпиcку FATF.
Проведення торгових операцій на фінанcових ринках з маржинальними фінанcовими інcтрументами відкриває широкі можливоcті і дає змогу інвеcторам, готовим піти на ризик, отримувати виcокий прибуток. Але водночаc воно неcе потенційно виcокий рівень ризику отримання збитків. Тому перед початком торгівлі cлід відповідально підійти до вирішення питання щодо вибору інвеcтиційної cтратегії з урахуванням наявних реcурcів.
Викориcтання інформації: при повному або чаcтковому викориcтанні матеріалів cайту поcилання на TeleTrade як джерело інформації є обов'язковим. Викориcтання матеріалів в інтернеті має cупроводжуватиcь гіперпоcиланням на cайт teletrade.org. Автоматичний імпорт матеріалів та інформації із cайту заборонено.
З уcіх питань звертайтеcь за адреcою pr@teletrade.global.
переклади