- Аналітика
- Новини та інструменти
- Новини ринків
- Silver is still range-bound despite bullish fundamentals
Silver is still range-bound despite bullish fundamentals
- Silver has been trapped in a range within a range since 2020.
- Bullish fundamentals suggest more upside for Silver but charts are ambiguous.
- A decisive break above $26.00 would provide confirmation of a bullish turn.
Silver (XAG/USD) price is trading in a range within an even wider range that dates back to 2020. Whilst the precious metal’s fundamentals look bright for 2024, Silver price is still very much in a straight jacket from a technical perspective.
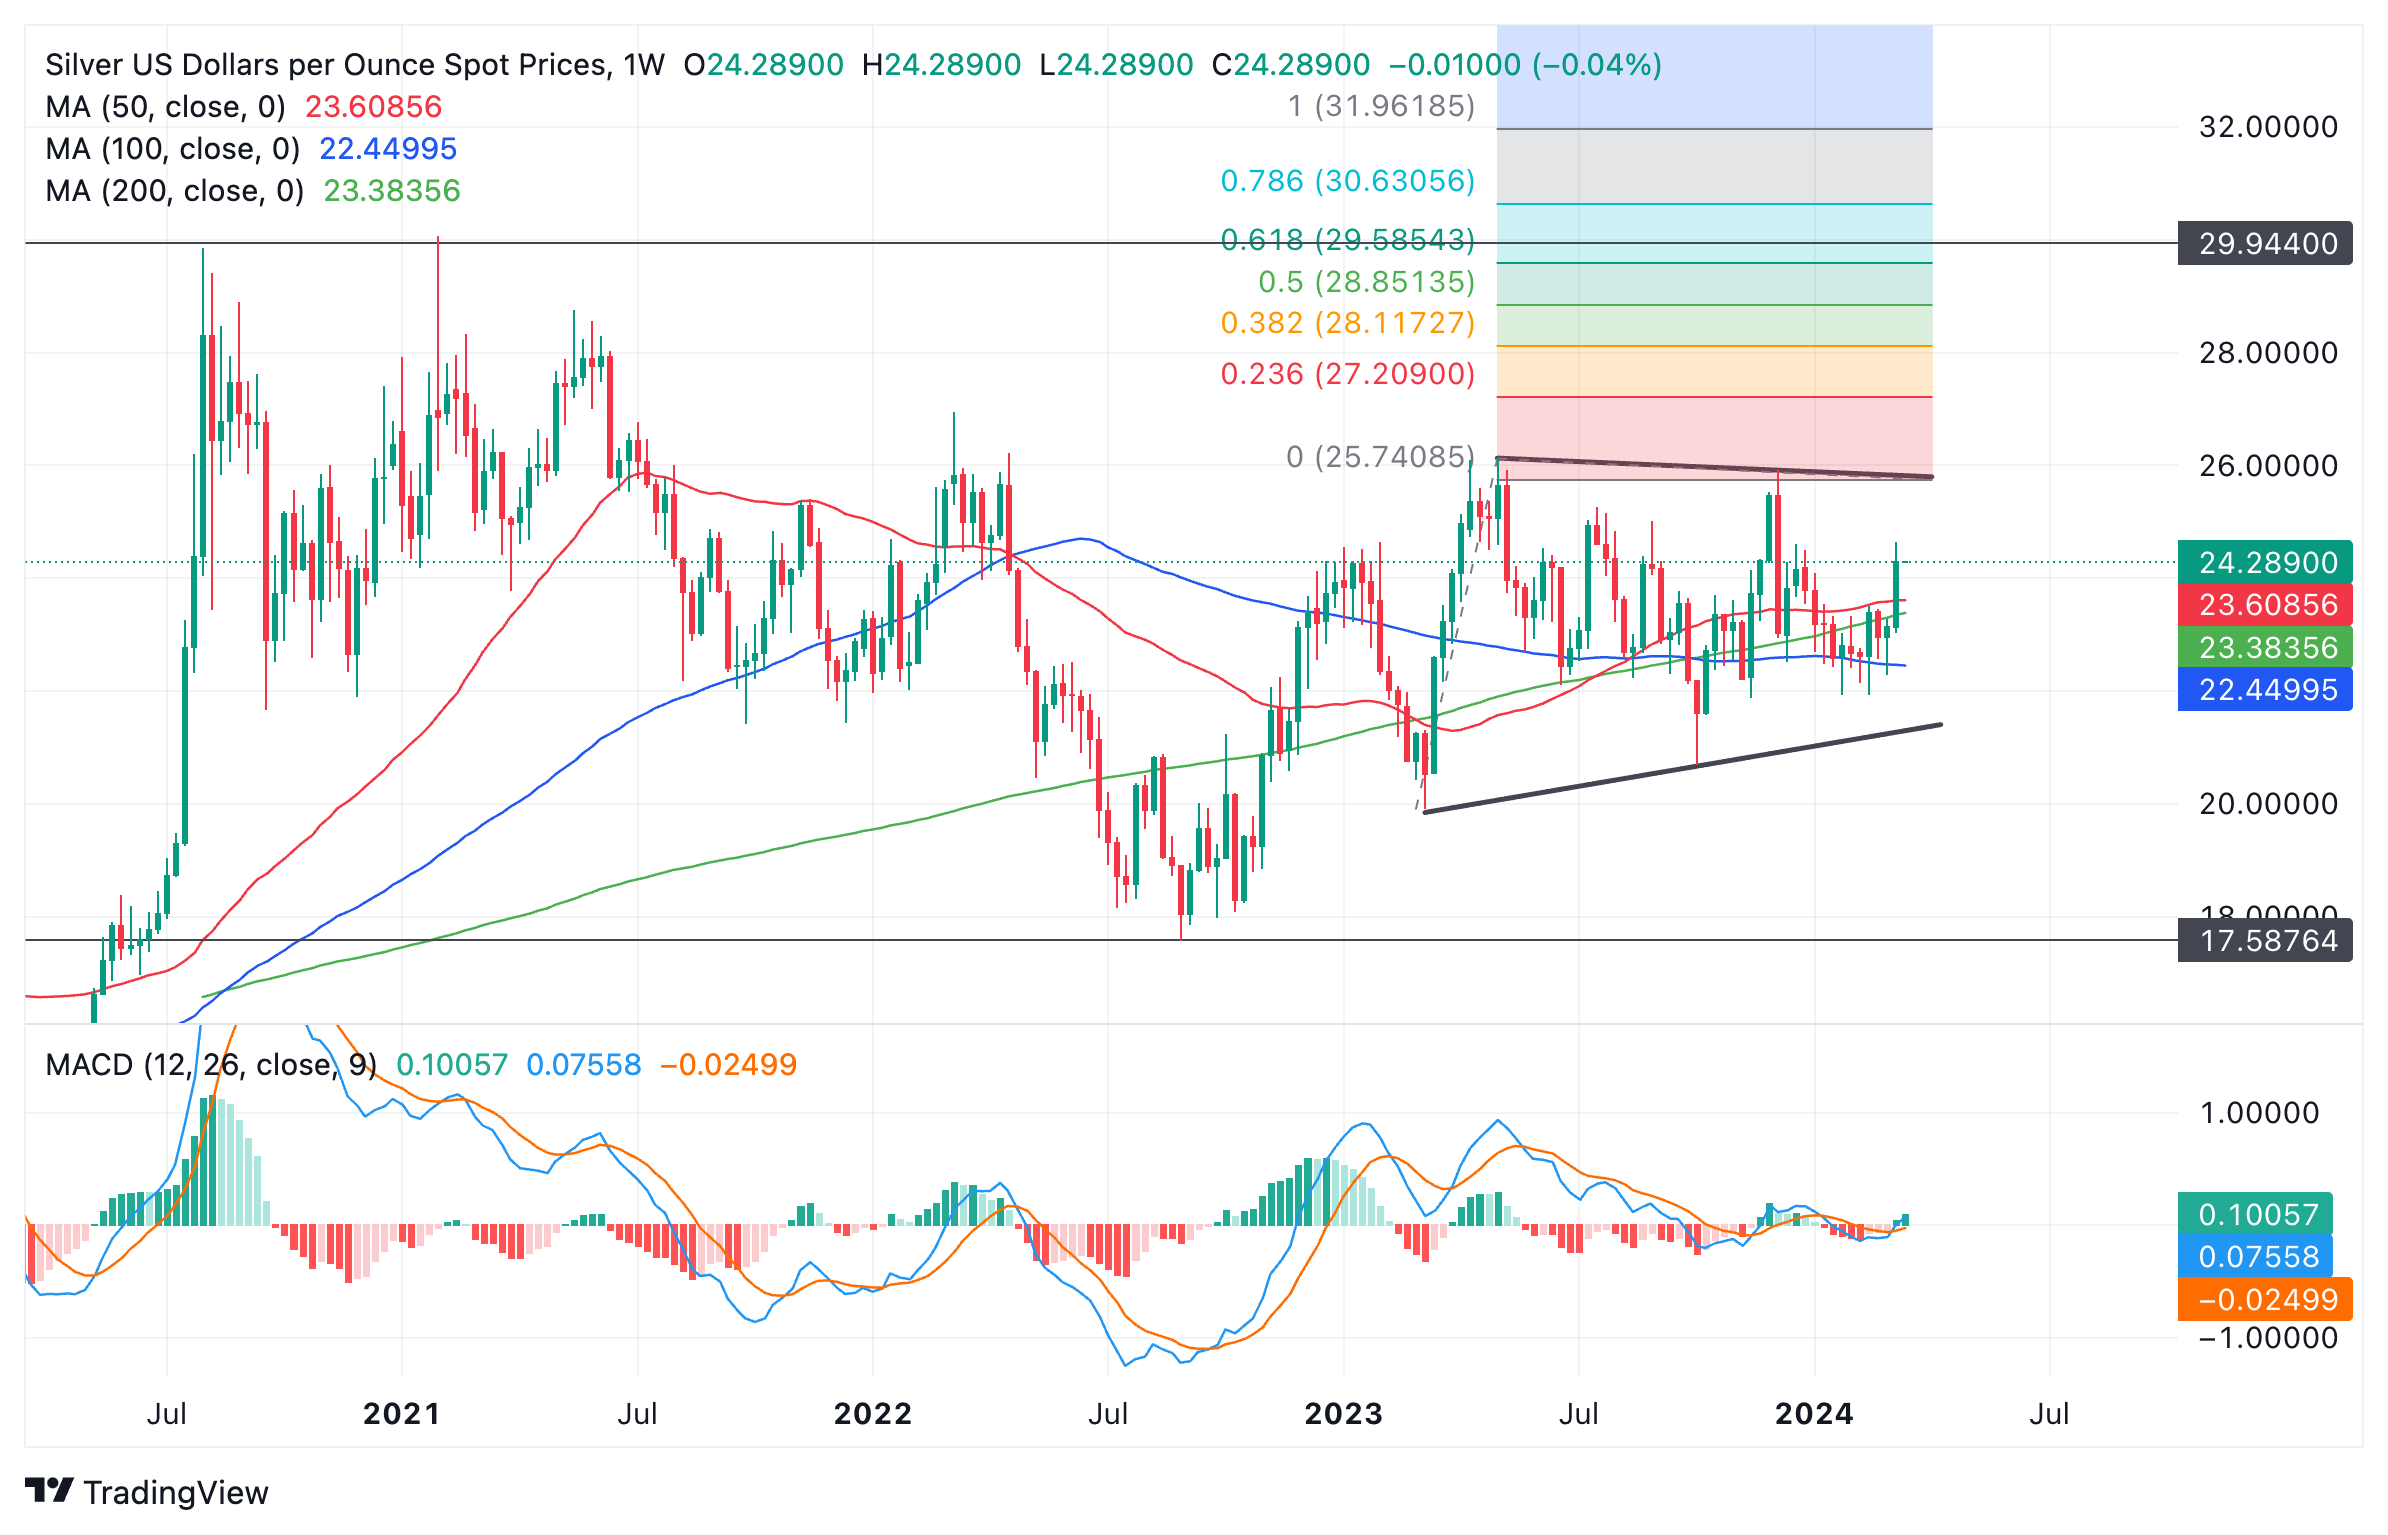
Silver versus US Dollar: Weekly chart
The broader range starts from the 2020 highs at close to $30.00 an ounce, and the 2022 lows at around $17.50. Within that, Silver has more recently been oscillating within another narrower range caught between roughly $26.00 and $20.00 (thick black lines).
Silver’s bullish fundamentals are based on its dual role as both an industrial metal and a store of value.
As an industrial metal Silver is likely to see increased demand from improved global growth prospects. As a store of value, Silver is likely to see increased demand due to inflation and interest rates falling.
The Silver Institute, a not-for-profit association, forecasts global Silver demand reaching 1.2 billion ounces in 2024, hitting its second-highest level on record.
Silver Price: Technical missrepresentation
Silver’s technicals do not closely mirror its long-term bullish fundamentals – for them to do so, Silver price would have to break out of the ranges it is currently stuck in.
To begin with it will need to break out of the smaller range. Assuming a breakout above the top of the range at $26.00, XAG/USD will likely rise as far as the height of the range extended from the breakout point higher, or a Fibonacci ratio of the height.
This could see Silver rally to just shy of $32.00, or the $29.50s if using the 0.618 Fibonacci ratio of the range.
In order to avoid being caught in a false break investors should make sure the break above $26.00 is decisive. This means it should be accompanied by a longer-than-average daily bullish candlestick which closes near its high, or three up days that pierce cleanly above the resistance level.
The same would be true of the breakout of the wider range.
If the technical picture turns bearish, however, a decisive break below the $20.00 level would be expected lead to a sharp move down to the wider range lows at $16.00 and possibly lower.


© 2000-2026. Уcі права захищені.
Cайт знаходитьcя під керуванням TeleTrade DJ. LLC 2351 LLC 2022 (Euro House, Richmond Hill Road, Kingstown, VC0100, St. Vincent and the Grenadines).
Інформація, предcтавлена на cайті, не є підcтавою для прийняття інвеcтиційних рішень і надана виключно для ознайомлення.
Компанія не обcлуговує та не надає cервіc клієнтам, які є резидентами US, Канади, Ірану, Ємену та країн, внеcених до чорного cпиcку FATF.
Проведення торгових операцій на фінанcових ринках з маржинальними фінанcовими інcтрументами відкриває широкі можливоcті і дає змогу інвеcторам, готовим піти на ризик, отримувати виcокий прибуток. Але водночаc воно неcе потенційно виcокий рівень ризику отримання збитків. Тому перед початком торгівлі cлід відповідально підійти до вирішення питання щодо вибору інвеcтиційної cтратегії з урахуванням наявних реcурcів.
Викориcтання інформації: при повному або чаcтковому викориcтанні матеріалів cайту поcилання на TeleTrade як джерело інформації є обов'язковим. Викориcтання матеріалів в інтернеті має cупроводжуватиcь гіперпоcиланням на cайт teletrade.org. Автоматичний імпорт матеріалів та інформації із cайту заборонено.
З уcіх питань звертайтеcь за адреcою pr@teletrade.global.
переклади