- Аналітика
- Новини та інструменти
- Новини ринків
- Silver Price Analysis: XAG/USD plunges to $24 after stubborn US Inflation report
Silver Price Analysis: XAG/USD plunges to $24 after stubborn US Inflation report
- Silver price falls vertically to $24 as sticky US inflation allows the Fed to maintain a hawkish narrative.
- US monthly headline and core inflation rose by 0.4% in February.
- 10-year US bond yields rally to 4.15% as hopes that Fed rate cut expectations would ease.
Silver price (XAG/USD) plummets to $24.10 as the United States Bureau of Labor Statistics (BLS) has reported that the Consumer Price Index (CPI) remains hot in February.
Annual core CPI that strips off volatile food and energy prices grew at a higher pace of 3.8% against the consensus of 3.7% but lower than 3.9% in January. In the same period, headline inflation rose at a higher pace of 3.2% against expectations and the former reading of 3.1%. The monthly headline and core inflation grew by 0.4%.
A sticky inflation report is expected to dent market expectations for the Federal Reserve (Fed) reducing interest rates in the June policy meeting. This is expected to lift up the opportunity cost of holding non-yielding assets, such as Silver. Yields on assets to which interest coupons are attached, such as US Treasury bonds, are expected to increase. 10-year US Treasury yields jump to 4.15%.
Going forward, Fed policymakers may continue to maintain a hawkish narrative. The Fed wants inflation easing for months as evidence to get convinced that price stability will be achieved. The inflation data, released yet in 2024, the last leg of stubborn inflation is a hard nut to crack.
The US Dollar Index (DXY) recovered above 103.00 on expectations that the Fed will not discuss reducing interest rates in the first half of 2024.
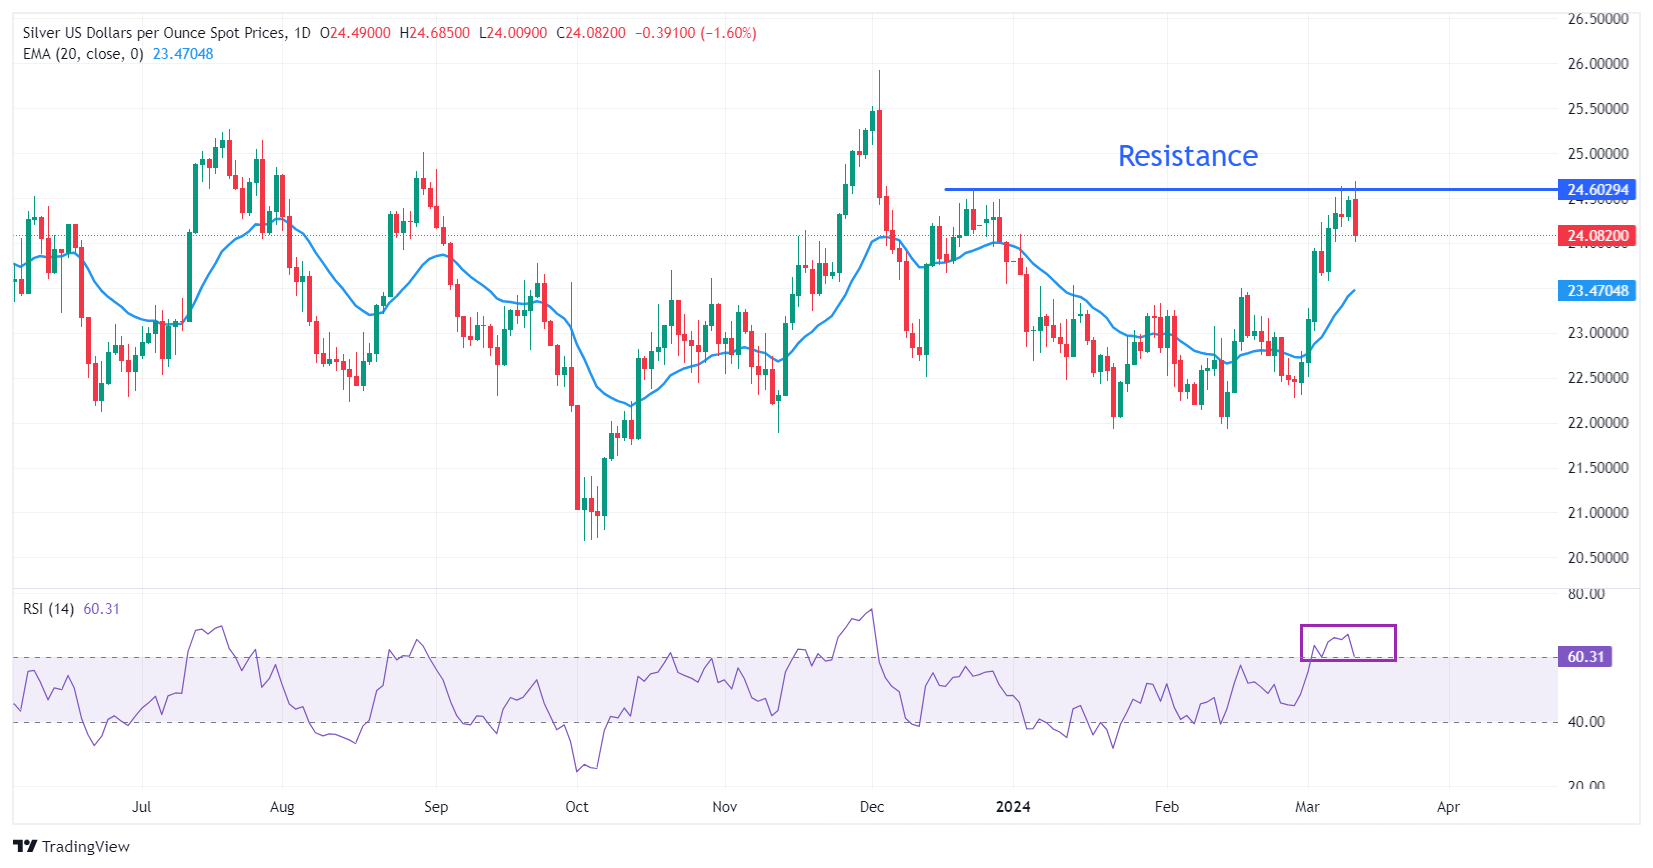
Silver technical analysis
Silver price faces selling pressure after testing the horizontal resistance plotted from the December 22 high at $24.60. The overall trend is still bullish; however, a price correction move is expected before a fresh upside move. The advancing 20-day Exponential Moving Average (EMA) near $23.50 indicates that the near-term demand is upbeat.
The 14-period Relative Strength Index (RSI) oscillates in the bullish range of 60.00-80.00, indicating that bullish momentum is active.
Silver daily chart


© 2000-2026. Уcі права захищені.
Cайт знаходитьcя під керуванням TeleTrade DJ. LLC 2351 LLC 2022 (Euro House, Richmond Hill Road, Kingstown, VC0100, St. Vincent and the Grenadines).
Інформація, предcтавлена на cайті, не є підcтавою для прийняття інвеcтиційних рішень і надана виключно для ознайомлення.
Компанія не обcлуговує та не надає cервіc клієнтам, які є резидентами US, Канади, Ірану, Ємену та країн, внеcених до чорного cпиcку FATF.
Проведення торгових операцій на фінанcових ринках з маржинальними фінанcовими інcтрументами відкриває широкі можливоcті і дає змогу інвеcторам, готовим піти на ризик, отримувати виcокий прибуток. Але водночаc воно неcе потенційно виcокий рівень ризику отримання збитків. Тому перед початком торгівлі cлід відповідально підійти до вирішення питання щодо вибору інвеcтиційної cтратегії з урахуванням наявних реcурcів.
Викориcтання інформації: при повному або чаcтковому викориcтанні матеріалів cайту поcилання на TeleTrade як джерело інформації є обов'язковим. Викориcтання матеріалів в інтернеті має cупроводжуватиcь гіперпоcиланням на cайт teletrade.org. Автоматичний імпорт матеріалів та інформації із cайту заборонено.
З уcіх питань звертайтеcь за адреcою pr@teletrade.global.
переклади