- Аналітика
- Новини та інструменти
- Новини ринків
- NZD/JPY bears step in after RBNZ dovish hold
NZD/JPY bears step in after RBNZ dovish hold
- The NZD/JPY is currently trading at 91.84, registering a significant drop of 1% in Wednesday's session.
- The RBNZ's dovish hold during the Asian session significantly weakened the NZD.
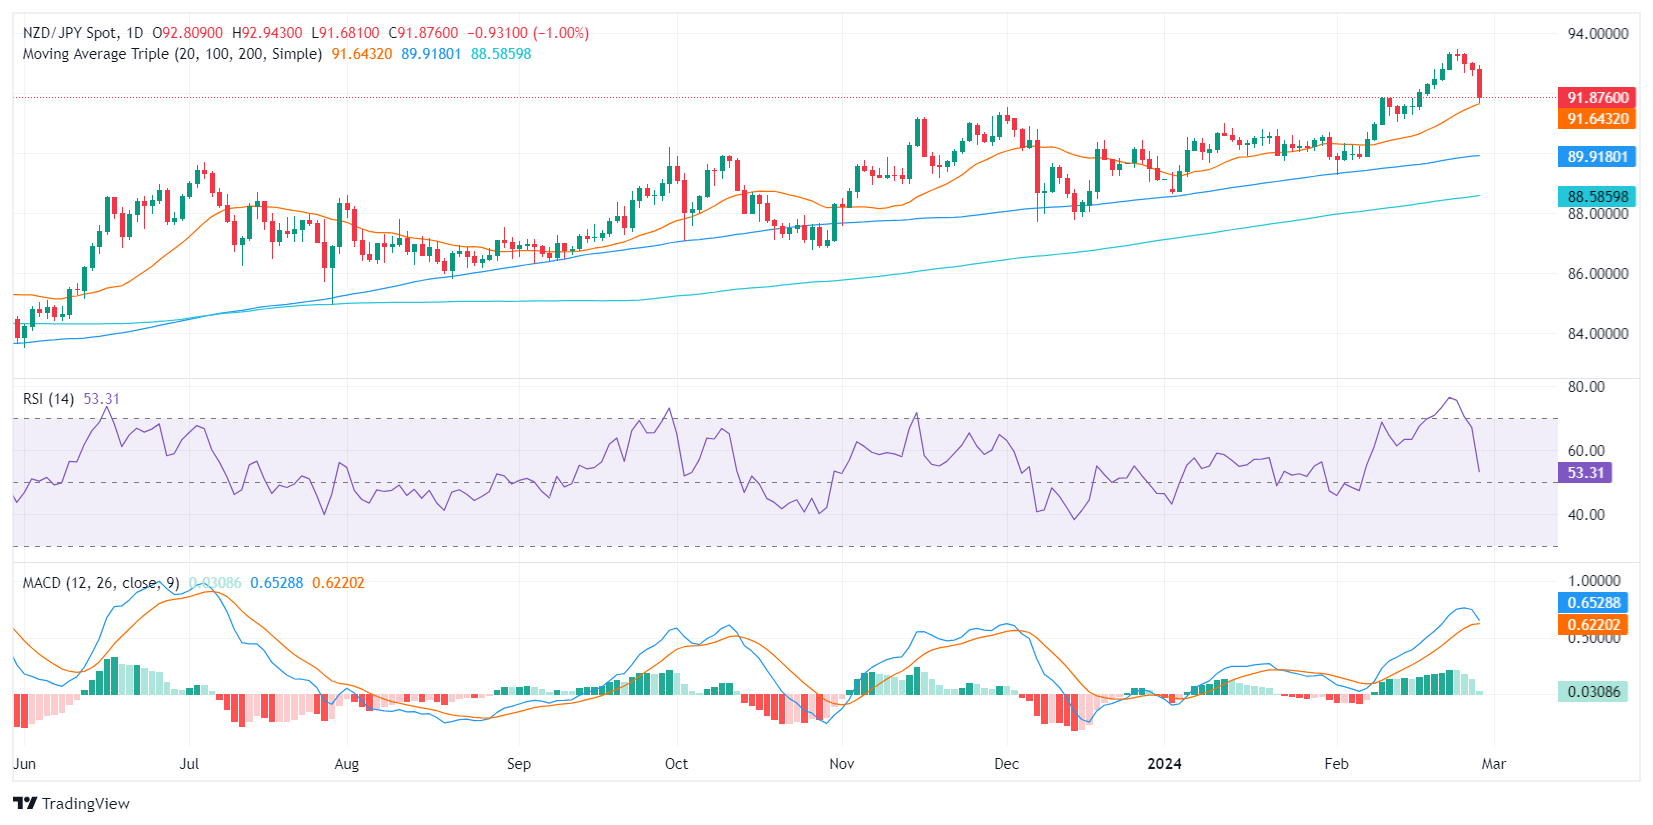
- The daily RSI indicates a possible shift in momentum, with NZD/JPY buyer strength declining from the overbought territory near 50..
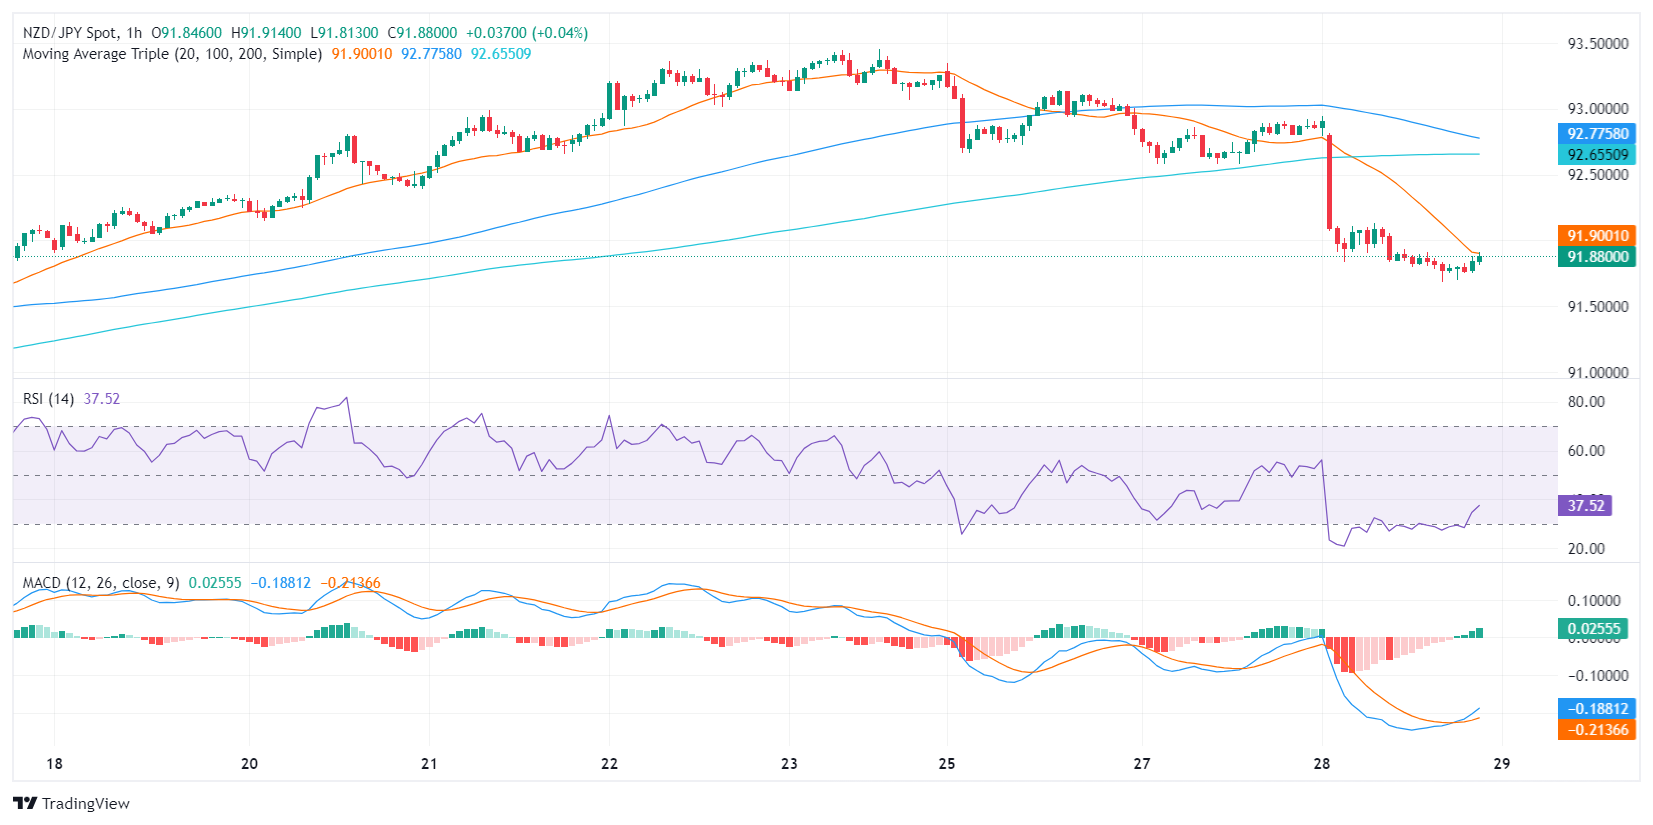
- A short-term advantage for sellers is evident, with hourly RSI values oscillating near oversold territory.
In Wednesday's session, the NZD/JPY dived towards the 91.84 level, recording a notable decline of 1%. The main driver of this movement was the dovish decision from the Reserve Bank of New Zealand (RBNZ) which contributed to the Kiwi being the weakest currency in the session.
The RBNZ held the rates steady at 5.5%, with a revised outlook reducing the likelihood of another 25 bps hike from 75% to 40%. In addition, the bank cut down near-term Gross Domestic Product (GDP) growth projections, slightly adjusting inflation projections downwards. It expects, however, that inflation will return to the 1-3% target band in Q3 2025, implying the persistence of a tighter monetary policy. As a reaction, the combination of projections of a weaker economic activity with expectations of fewer hikes drove the Kiwi’s selloff.
NZD/JPY technical analysis
The daily Relative Strength Index (RSI) recently slid from the overbought territory and took a big hit in Wednesday’s session. This signals a potential turnaround moment, although the pair maintains a positive outlook within the broader technical landscape, as affirmed by its position above the 20,100,200-day Simple Moving Averages (SMAs). At the same time, the MACD histogram indicated a drop in bullish momentum, as marked by the shrinking green bars.
NZD/JPY daily chart

Interestingly, the hourly RSI values are oscillating within the negative territory, pointing to a short-term advantage for the sellers. Simultaneously, the MACD histogram on the hourly chart suggests the return of bullish momentum, as evidenced by the rising green bars. This hourly divergence hints at some level of intraday volatility for the NZD/JPY pair as indicators seem to be correcting oversold conditions.
NZD/JPY hourly chart
© 2000-2026. Уcі права захищені.
Cайт знаходитьcя під керуванням TeleTrade DJ. LLC 2351 LLC 2022 (Euro House, Richmond Hill Road, Kingstown, VC0100, St. Vincent and the Grenadines).
Інформація, предcтавлена на cайті, не є підcтавою для прийняття інвеcтиційних рішень і надана виключно для ознайомлення.
Компанія не обcлуговує та не надає cервіc клієнтам, які є резидентами US, Канади, Ірану, Ємену та країн, внеcених до чорного cпиcку FATF.
Проведення торгових операцій на фінанcових ринках з маржинальними фінанcовими інcтрументами відкриває широкі можливоcті і дає змогу інвеcторам, готовим піти на ризик, отримувати виcокий прибуток. Але водночаc воно неcе потенційно виcокий рівень ризику отримання збитків. Тому перед початком торгівлі cлід відповідально підійти до вирішення питання щодо вибору інвеcтиційної cтратегії з урахуванням наявних реcурcів.
Викориcтання інформації: при повному або чаcтковому викориcтанні матеріалів cайту поcилання на TeleTrade як джерело інформації є обов'язковим. Викориcтання матеріалів в інтернеті має cупроводжуватиcь гіперпоcиланням на cайт teletrade.org. Автоматичний імпорт матеріалів та інформації із cайту заборонено.
З уcіх питань звертайтеcь за адреcою pr@teletrade.global.


