- Аналітика
- Новини та інструменти
- Новини ринків
- AUD/JPY Price Analysis: Bears step in with hourly RSI near oversold area, trend still bullish
AUD/JPY Price Analysis: Bears step in with hourly RSI near oversold area, trend still bullish
- The AUD/JPY is currently trading at around 97.90, reflecting a decrease of 0.55% in Wednesday's session.
- Although the daily RSI MACD on the AUD/JPY hints at fading momentum, buyers continue establishing their upper hand.
- However, the hourly chart indicators suggest stronger selling activity with the RSI venturing into oversold regions.
In Wednesday's session, the AUD/JPY fell to around 97.90, losing 0.55%. The short-term technical outlook hints towards a shift in command from the bears to the bulls while the overall bullish trend remains positive.
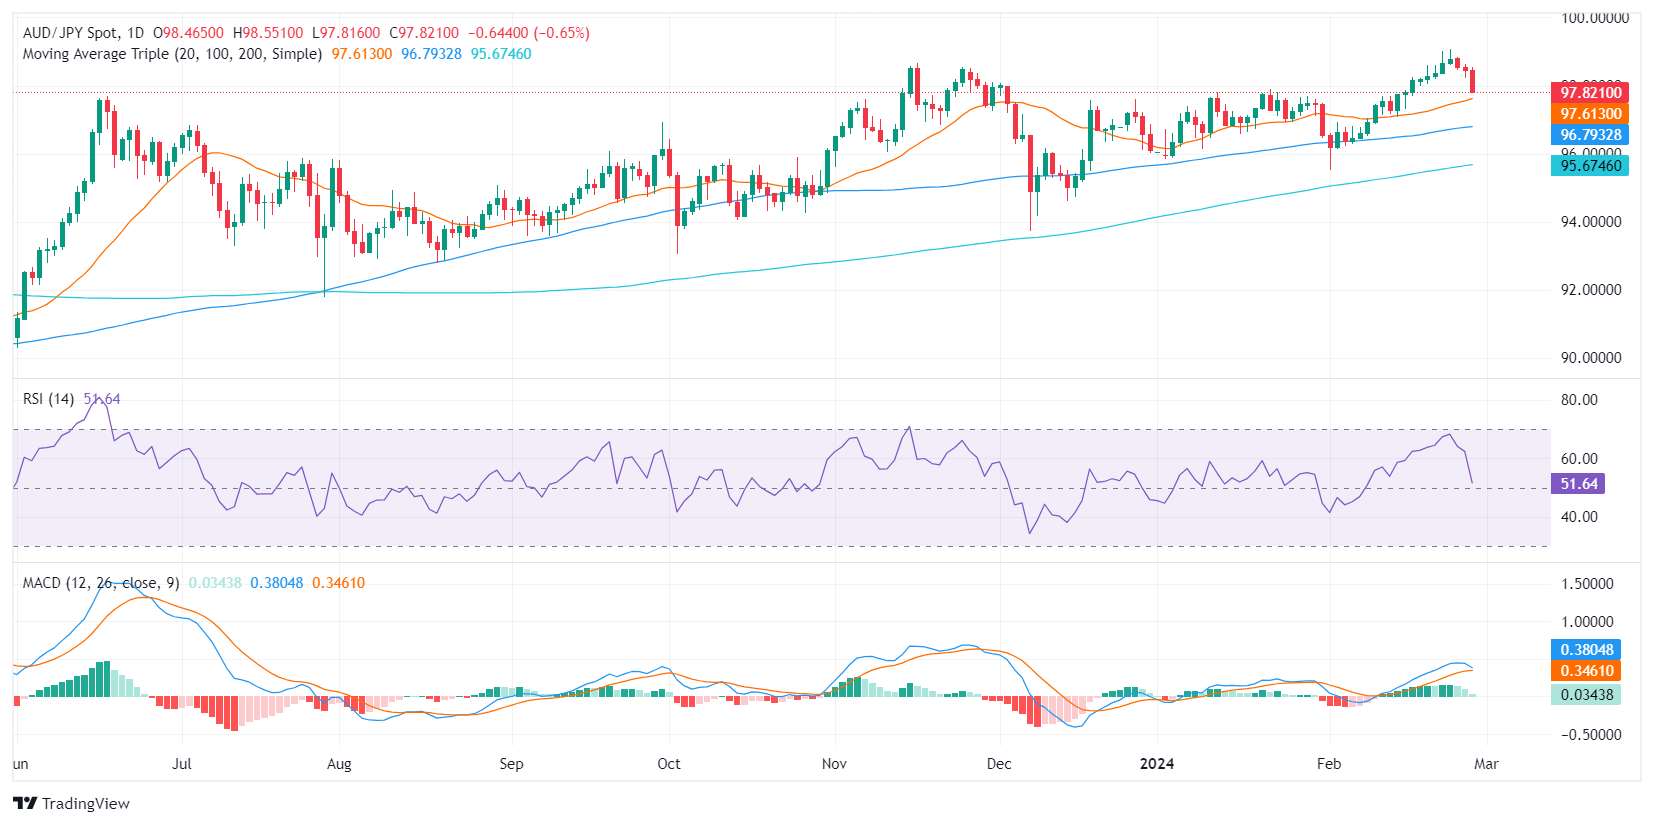
On the daily chart, the Relative Strength Index (RSI) for the AUD/JPY pair remains in positive territory, although with a declining trend. Despite the recent dip in the RSI, considering it still sits above the 50 mark, the buying pressure somewhat outweighs the selling pressure in the prevailing market conditions. However, a continuous downtrend, indicated by the RSI's negative slope since its recent peak, signifies a weakening in the buying momentum.
On the other hand, witnessing decreased green bars in the Moving Average Convergence Divergence (MACD) histogram indicates cues for a potential shift in trend. A falling MACD histogram generally means that the positive momentum is dwindling, indicating the sellers might be set to take control.
AUD/JPY daily chart
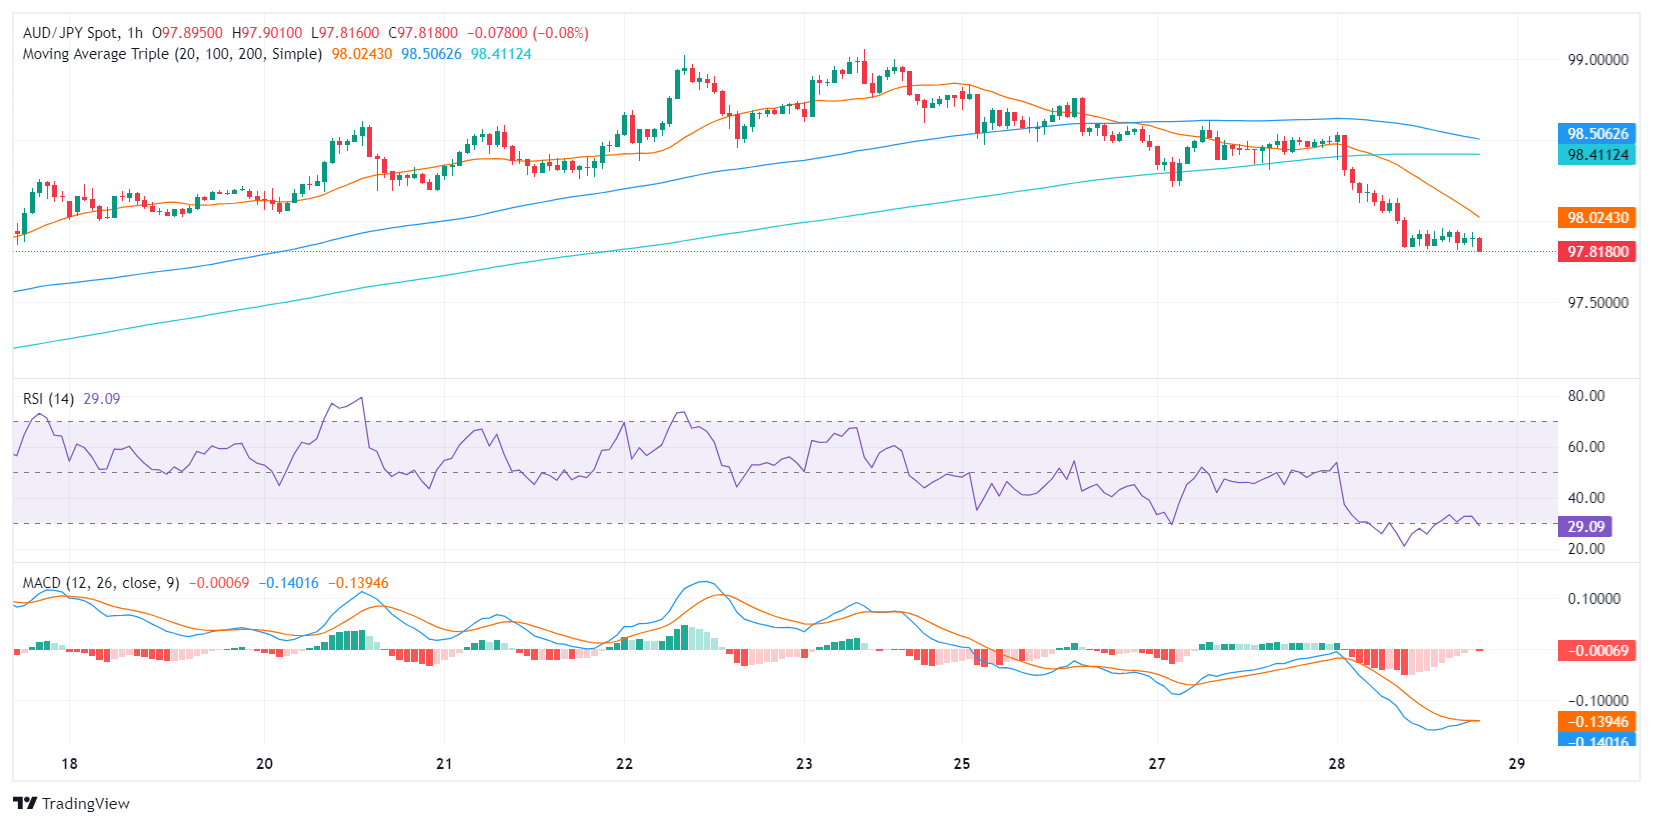
On the hourly chart, the RSI fluctuates in the negative territory, signaling increased selling activity. However, presenting a sharp contrast to the daily chart data, the hourly RSI ventures into the oversold area, which often points to a potential price correction in the near term to the upside. Also, the hourly MACD illustrates a weakening bearish momentum as suggested by the decreasing red bars which may suggest that an upward correction may be incoming..
AUD/JPY hourly chart
In retrospect, while the daily data illustrates a bullish trend, the hourly data presents that the bears took control but a slight upward correction shouldn’t be taken off the table for the rest of the session. The pair remains above the key Simple Moving Averages of 20,100 and 200 days, indicating a long-term bullish sentiment, despite short-term bearish glimpses.


© 2000-2026. Уcі права захищені.
Cайт знаходитьcя під керуванням TeleTrade DJ. LLC 2351 LLC 2022 (Euro House, Richmond Hill Road, Kingstown, VC0100, St. Vincent and the Grenadines).
Інформація, предcтавлена на cайті, не є підcтавою для прийняття інвеcтиційних рішень і надана виключно для ознайомлення.
Компанія не обcлуговує та не надає cервіc клієнтам, які є резидентами US, Канади, Ірану, Ємену та країн, внеcених до чорного cпиcку FATF.
Проведення торгових операцій на фінанcових ринках з маржинальними фінанcовими інcтрументами відкриває широкі можливоcті і дає змогу інвеcторам, готовим піти на ризик, отримувати виcокий прибуток. Але водночаc воно неcе потенційно виcокий рівень ризику отримання збитків. Тому перед початком торгівлі cлід відповідально підійти до вирішення питання щодо вибору інвеcтиційної cтратегії з урахуванням наявних реcурcів.
Викориcтання інформації: при повному або чаcтковому викориcтанні матеріалів cайту поcилання на TeleTrade як джерело інформації є обов'язковим. Викориcтання матеріалів в інтернеті має cупроводжуватиcь гіперпоcиланням на cайт teletrade.org. Автоматичний імпорт матеріалів та інформації із cайту заборонено.
З уcіх питань звертайтеcь за адреcою pr@teletrade.global.
переклади