- Аналітика
- Новини та інструменти
- Новини ринків
- AUD/JPY Price Analysis: Buyers hold sway with hints of increasing sell-off, cross still in multi-year highs
AUD/JPY Price Analysis: Buyers hold sway with hints of increasing sell-off, cross still in multi-year highs
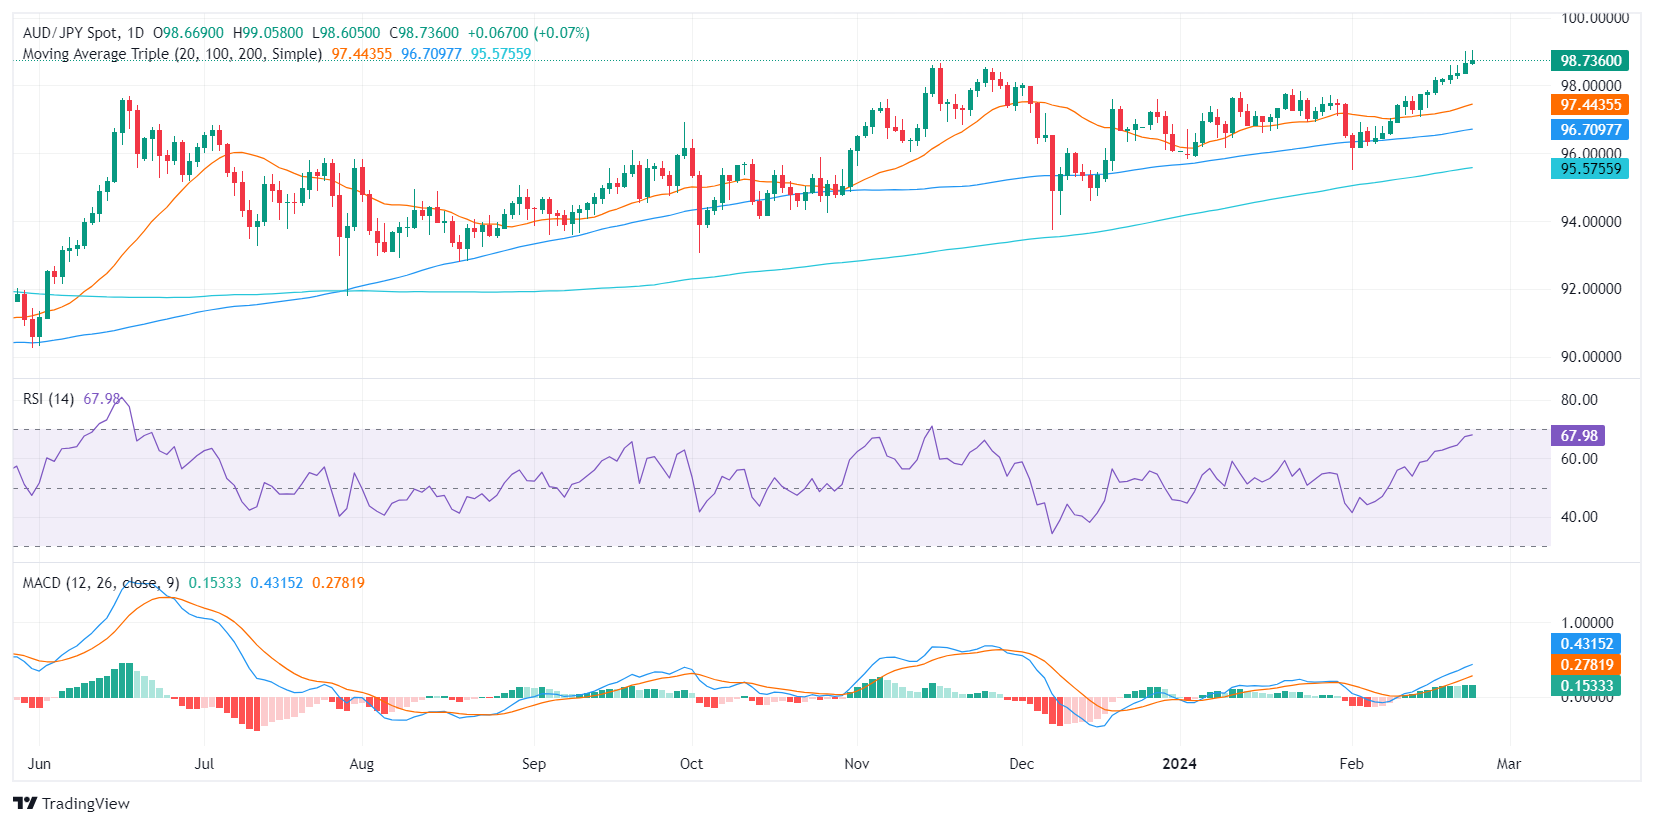
- The AUD/JPY is trading at 98.71, showing a slight gain during the Friday session still in highs since 2015.
- Daily RSI for the AUD/JPY suggests bullish momentum with a slight increase in the positive area.
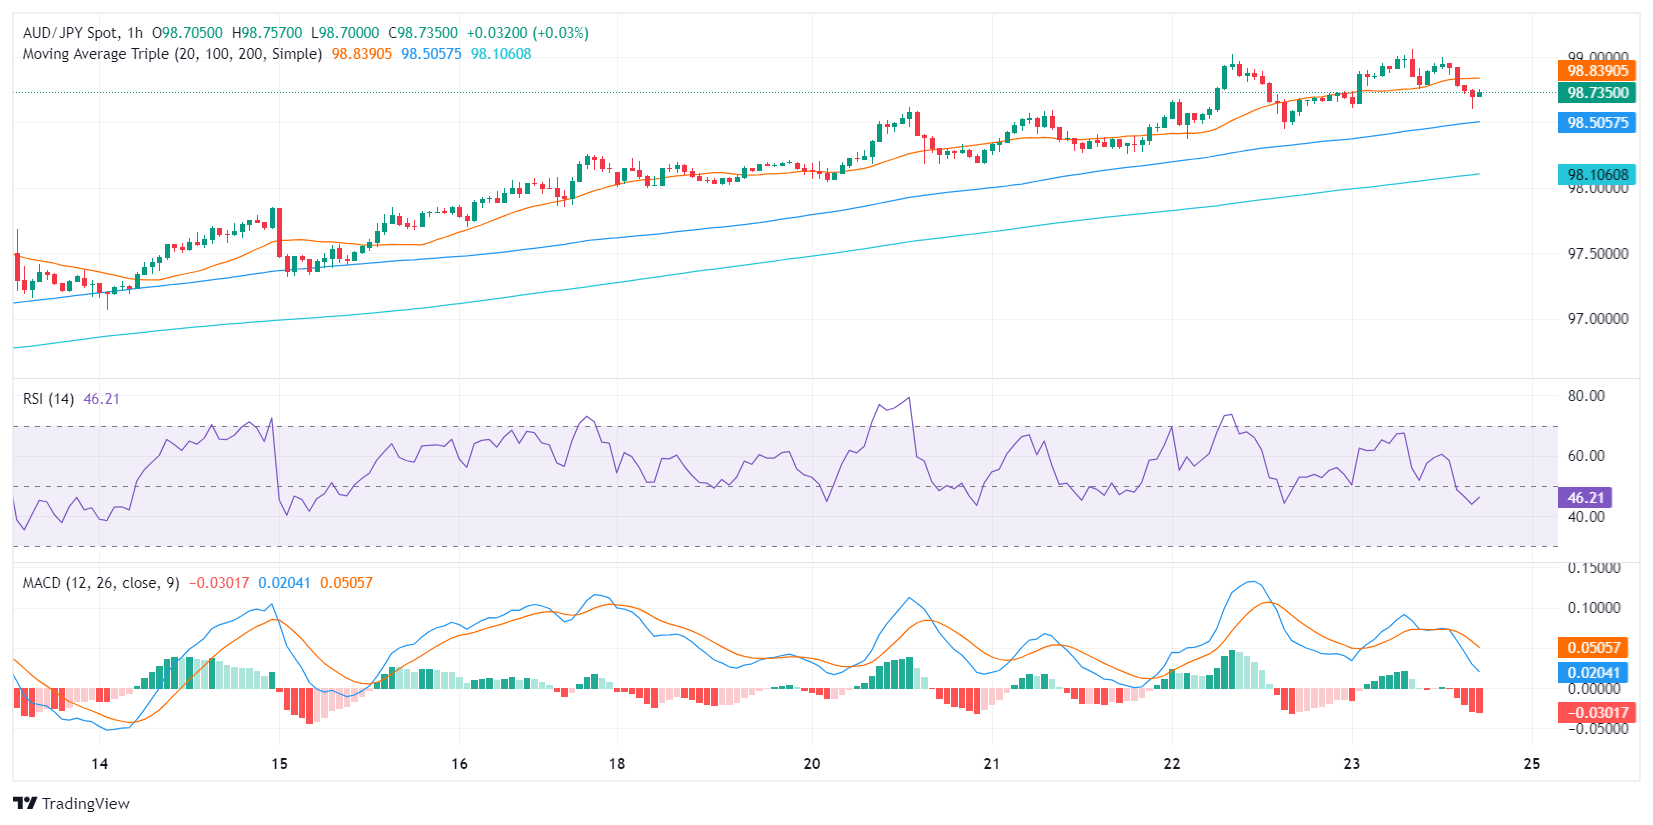
- Divergences are observed between the hourly and daily charts where the latter signals buyers' dominance whilst the hourly chart indicates rising short-term selling pressure.
In Friday's session, the AUD/JPY pair is trading at 98.715, reflecting a slight increase in buying pressure. The daily chart signals that the buyers are in control but that bears are starting to wake up, while in the hourly chart, the consolidation is more evident with indicators losing ground.
On the daily chart, the Relative Strength Index (RSI) pair shows a positive stance, signifying the dominance of buyers. This can be inferred from RSI territory, which consistently remains positive, despite a marginal downtrend observed within the positive territory. This suggests a slight increase in selling pressure, however, buyers continue to hold dominance given the RSI's positive territory position.
Concurrent with this, the daily Moving Average Convergence Divergence (MACD) is exhibiting flat green bars. This indicates that the momentum of the market is neutral on the surface, yet further scrutiny reveals that buyers hold the upper hand as the pair lingers above the 20, 100, and 200-day Simple Moving Averages (SMAs).
AUD/JPY daily chart
Upon examining the hourly chart, the RSI's position has diverted into negative territory while the MACD presents rising red bars suggesting a surge in selling pressure in the short term, contrasting the positive bias observed in the daily chart.
AUD/JPY hourly chart
Conclusively, despite a short-term rise in selling pressure observed in the hourly chart, the longer-term daily chart suggests that buyers continue to control the market, fortified by the pair's position above the 20, 100, and 200-day SMAs.


© 2000-2026. Уcі права захищені.
Cайт знаходитьcя під керуванням TeleTrade DJ. LLC 2351 LLC 2022 (Euro House, Richmond Hill Road, Kingstown, VC0100, St. Vincent and the Grenadines).
Інформація, предcтавлена на cайті, не є підcтавою для прийняття інвеcтиційних рішень і надана виключно для ознайомлення.
Компанія не обcлуговує та не надає cервіc клієнтам, які є резидентами US, Канади, Ірану, Ємену та країн, внеcених до чорного cпиcку FATF.
Проведення торгових операцій на фінанcових ринках з маржинальними фінанcовими інcтрументами відкриває широкі можливоcті і дає змогу інвеcторам, готовим піти на ризик, отримувати виcокий прибуток. Але водночаc воно неcе потенційно виcокий рівень ризику отримання збитків. Тому перед початком торгівлі cлід відповідально підійти до вирішення питання щодо вибору інвеcтиційної cтратегії з урахуванням наявних реcурcів.
Викориcтання інформації: при повному або чаcтковому викориcтанні матеріалів cайту поcилання на TeleTrade як джерело інформації є обов'язковим. Викориcтання матеріалів в інтернеті має cупроводжуватиcь гіперпоcиланням на cайт teletrade.org. Автоматичний імпорт матеріалів та інформації із cайту заборонено.
З уcіх питань звертайтеcь за адреcою pr@teletrade.global.
переклади