- Аналітика
- Новини та інструменти
- Новини ринків
- USD/CAD Price Analysis: Trades with modest losses below mid-1.3500s, 100-day SMA
USD/CAD Price Analysis: Trades with modest losses below mid-1.3500s, 100-day SMA
- USD/CAD drifts lower for the second straight day amid a modest USD downtick.
- Sliding Oil prices undermine the Loonie and should help limit any further losses.
- The technical setup warrants caution before positioning for a meaningful decline.
The USD/CAD pair turns lower for the second successive day on Thursday and moves away from a fresh YTD peak, around the 1.3585 region touched earlier this week. Spot prices trade around the 1.3535-1.3530 area, down less than 0.10% during the first half of the European session as traders now look to the US macro data for a fresh impetus.
A further decline in the US Treasury bond yields keeps the US Dollar (USD) bulls on the defensive below its highest level since November 14 touched the previous day and is seen as a key factor weighing on the USD/CAD pair. That said, the prevalent selling bias around Crude Oil prices might undermine the commodity-linked Loonie and help limit any meaningful downside.
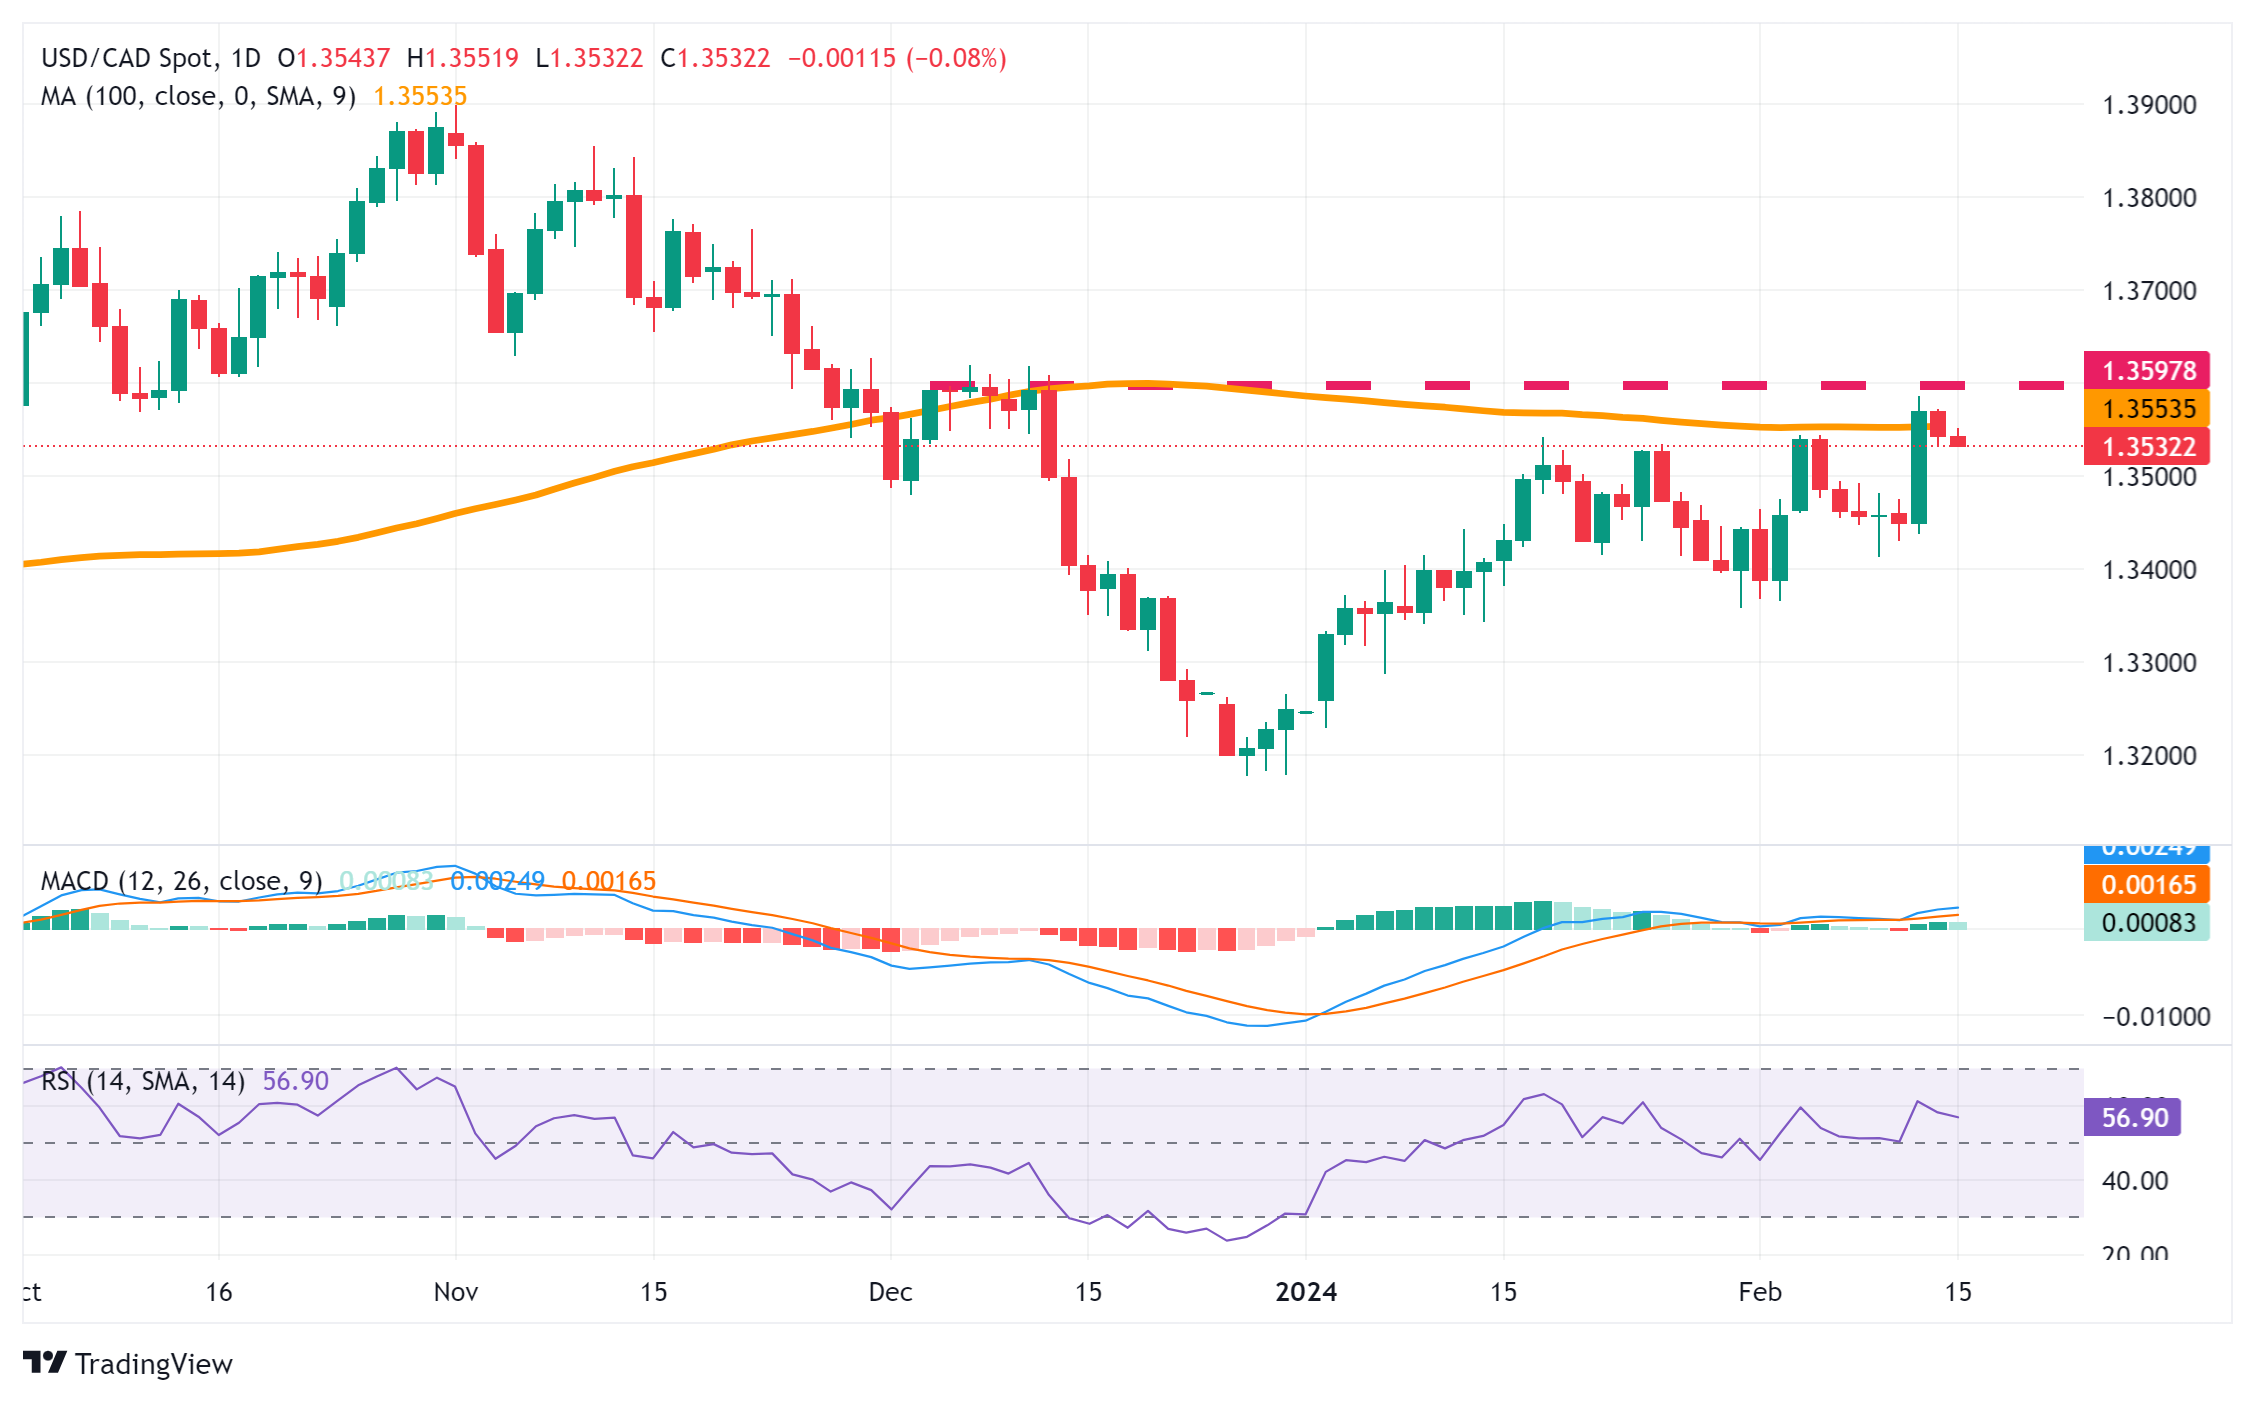
From a technical perspective, the USD/CAD pair once again struggled to find acceptance above the 100-day Simple Moving Average (SMA). The subsequent slide from the 1.3600 neighbourhood constitutes the formation of a double-top pattern on the daily chart. That said, oscillators on the daily chart are still holding in the positive territory and warrant caution for bears.
Hence, it will be prudent to wait for strong follow-through selling before confirming that the USD/CAD pair has topped out in the near term and positioning for any meaningful corrective decline. In the meantime, the 1.3500 psychological mark is likely to protect the immediate downside ahead of the very important 200-day SMA, currently pegged around the 1.3475 region.
Sustained weakness below the latter might prompt some technical selling and drag the USD/CAD pair below intermediate support near mid-1.3400s, towards last week's swing low, around the 1.3415-1.3410 region. This is closely followed by the 1.3400 mark, which if broken decisively will be seen as a fresh trigger for bearish traders and pave the way for additional losses.
On the flip side, the 100-day SMA, around the 1.3565 zone, followed by a two-month top near the 1.3585 region, might continue to act as an immediate hurdle. Some follow-through buying, leading to a move beyond the 1.3600 mark and the 1.3620 supply zone, could lift the USD/CAD pair to the 1.3700 mark en route to the next relevant barrier near the 1.3745-1.3750 region.
USD/CAD daily chart
Technical levels to watch


© 2000-2026. Уcі права захищені.
Cайт знаходитьcя під керуванням TeleTrade DJ. LLC 2351 LLC 2022 (Euro House, Richmond Hill Road, Kingstown, VC0100, St. Vincent and the Grenadines).
Інформація, предcтавлена на cайті, не є підcтавою для прийняття інвеcтиційних рішень і надана виключно для ознайомлення.
Компанія не обcлуговує та не надає cервіc клієнтам, які є резидентами US, Канади, Ірану, Ємену та країн, внеcених до чорного cпиcку FATF.
Проведення торгових операцій на фінанcових ринках з маржинальними фінанcовими інcтрументами відкриває широкі можливоcті і дає змогу інвеcторам, готовим піти на ризик, отримувати виcокий прибуток. Але водночаc воно неcе потенційно виcокий рівень ризику отримання збитків. Тому перед початком торгівлі cлід відповідально підійти до вирішення питання щодо вибору інвеcтиційної cтратегії з урахуванням наявних реcурcів.
Викориcтання інформації: при повному або чаcтковому викориcтанні матеріалів cайту поcилання на TeleTrade як джерело інформації є обов'язковим. Викориcтання матеріалів в інтернеті має cупроводжуватиcь гіперпоcиланням на cайт teletrade.org. Автоматичний імпорт матеріалів та інформації із cайту заборонено.
З уcіх питань звертайтеcь за адреcою pr@teletrade.global.
переклади