- Аналітика
- Новини та інструменти
- Новини ринків
- USD/NOK declines following Norway's Q4 GDP figures
USD/NOK declines following Norway's Q4 GDP figures
- The USD/NOK trades at 10.60 in Wednesday's session, recording a strong 0.73% downturn.
- USD maintains consolidation post-CPI gains while NOK rides on firm Q4 GDP data.
- Rate cut expectations from the Fed diminish with January US CPI coming in hot.
- On the Norwegian side, impressive 0.2% mainland GDP growth in Q4 suggests that the Norges Bank may delay cuts.
In Wednesday's session, the USD/NOK has been seen trading at 10.60 following a 0.73% slide downwards. This movement comes after a slight consolidation of the USD post-Consumer Price Index (CPI) gains and a robust performance by the NOK, driven by firm Q4 Gross Domestic Product (GDP) data.
To add to that, the Federal Reserve’s (Fed) rate cut remains unlikely in the short-term, with the January US CPI running hot with headline and core readings beating expectations. The data indicates a solid economic condition, minimizing the chances of Fed easing. A notably worrying fact for the Federal Reserve is a rise in super core by 4.3% YoY from 3.9% in December, showcasing that inflationary pressure persists. Regardless, the odds for a rate cut in March linger around 10% and increase to a full expectation by June, which may limit the downside for the pair.
For Norway, mainland GDP grew by 0.2% in Q4 against Q3's 0.1%, propelled by consumer spending and net exports. The positive statistics are in line with Norges Bank's projections, affirming that they will likely maintain the policy rate at 4.5% for now. However, the swaps market forecasts a 50% chance of a rate cut in the next six months and if the Norwegian bank decides to delay cuts later than its American peer, the pair could see further downside.
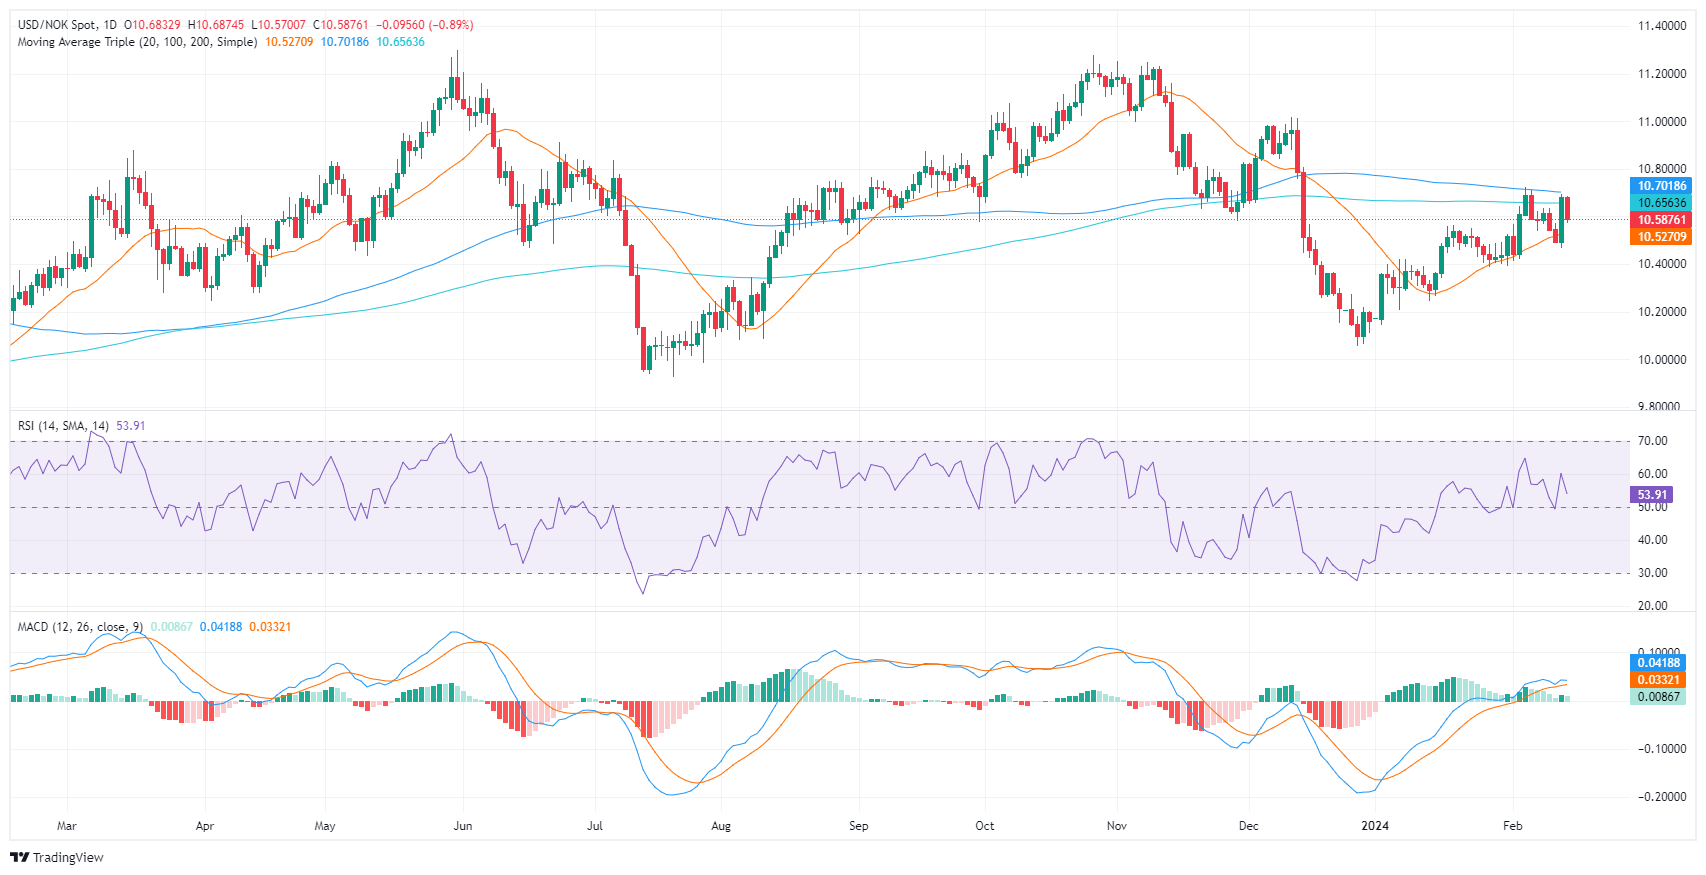
USD/NOK technical analysis
On the daily chart, the Relative Strength Index (RSI), it appears that the USDNOK pair has been fluctuating in the neutral zone, indicating a market with neither sellers nor buyers gaining control. Similarly, the Moving Average Convergence Divergence (MACD) histogram, although green, suggests a loss of bullish momentum as its bars have been decreasing in height recently.
When taking into account the pair’s relation to the Simple Moving Averages, a bearish control is seen on a larger scale, as the pair is below the 100 and 200-day SMAs. However, considering the pair remains above the 20-day SMA, the bearish forces appear to lack enough strength in the short term.
USD/NOK daily chart


© 2000-2026. Уcі права захищені.
Cайт знаходитьcя під керуванням TeleTrade DJ. LLC 2351 LLC 2022 (Euro House, Richmond Hill Road, Kingstown, VC0100, St. Vincent and the Grenadines).
Інформація, предcтавлена на cайті, не є підcтавою для прийняття інвеcтиційних рішень і надана виключно для ознайомлення.
Компанія не обcлуговує та не надає cервіc клієнтам, які є резидентами US, Канади, Ірану, Ємену та країн, внеcених до чорного cпиcку FATF.
Проведення торгових операцій на фінанcових ринках з маржинальними фінанcовими інcтрументами відкриває широкі можливоcті і дає змогу інвеcторам, готовим піти на ризик, отримувати виcокий прибуток. Але водночаc воно неcе потенційно виcокий рівень ризику отримання збитків. Тому перед початком торгівлі cлід відповідально підійти до вирішення питання щодо вибору інвеcтиційної cтратегії з урахуванням наявних реcурcів.
Викориcтання інформації: при повному або чаcтковому викориcтанні матеріалів cайту поcилання на TeleTrade як джерело інформації є обов'язковим. Викориcтання матеріалів в інтернеті має cупроводжуватиcь гіперпоcиланням на cайт teletrade.org. Автоматичний імпорт матеріалів та інформації із cайту заборонено.
З уcіх питань звертайтеcь за адреcою pr@teletrade.global.
переклади